4P5T

14.C6 TCR complexed with MHC class II I-Ab/3K peptide


Experimental Data Snapshot

  • Method: X-RAY DIFFRACTION
  • Resolution: 3.26 Å
  • R-Value Free: 0.236 
  • R-Value Work: 0.186 
  • R-Value Observed: 0.189 

wwPDB Validation   3D Report Full Report


This is version 1.4 of the entry. See complete history


Literature

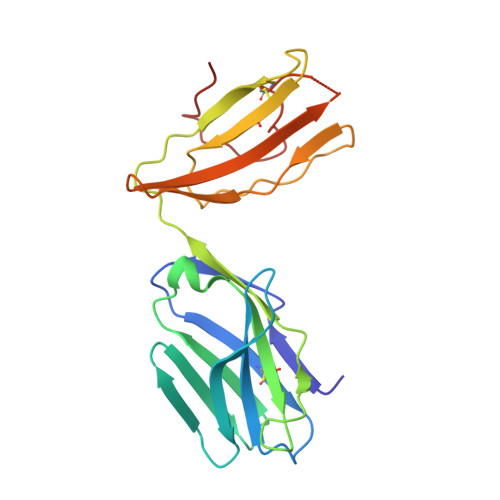
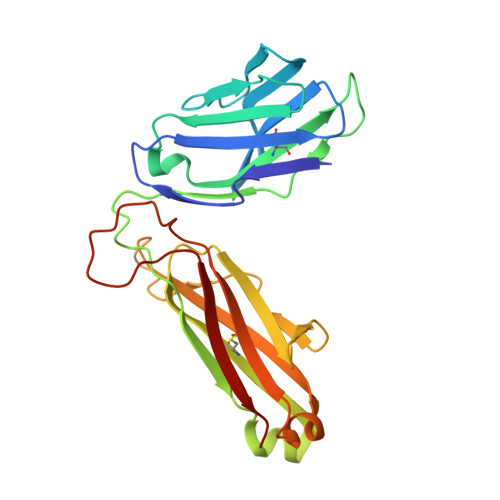
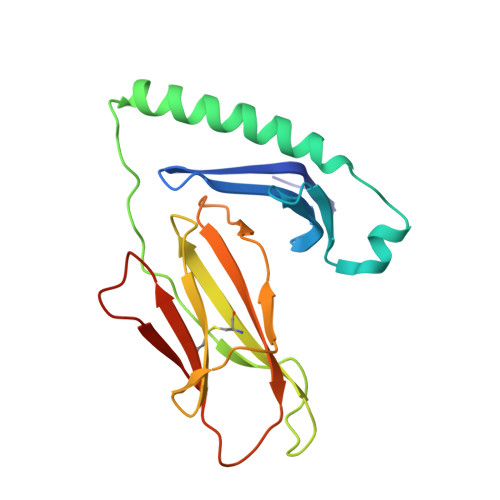
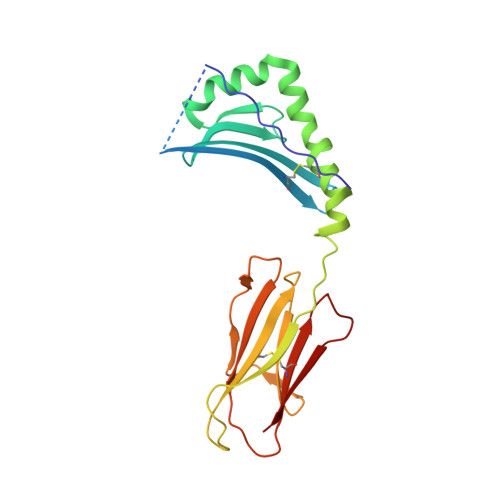
Effect of CDR3 Sequences and Distal V Gene Residues in Regulating TCR-MHC Contacts and Ligand Specificity.

Stadinski, B.D.Trenh, P.Duke, B.Huseby, P.G.Li, G.Stern, L.J.Huseby, E.S.

(2014) J Immunol 192: 6071-6082

  • DOI: https://doi.org/10.4049/jimmunol.1303209
  • Primary Citation of Related Structures:  
    4P23, 4P46, 4P5T

  • PubMed Abstract: 

    The mature T cell repertoire has the ability to orchestrate immunity to a wide range of potential pathogen challenges. This ability stems from thymic development producing individual T cell clonotypes that express TCRs with unique patterns of Ag reactivity. The Ag specificity of TCRs is created from the combinatorial pairing of one of a set of germline encoded TCR Vα and Vβ gene segments with randomly created CDR3 sequences. How the amalgamation of germline encoded and randomly created TCR sequences results in Ag receptors with unique patterns of ligand specificity is not fully understood. Using cellular, biophysical, and structural analyses, we show that CDR3α residues can modulate the geometry in which TCRs bind peptide-MHC (pMHC), governing whether and how germline encoded TCR Vα and Vβ residues interact with MHC. In addition, a CDR1α residue that is positioned distal to the TCR-pMHC binding interface is shown to contribute to the peptide specificity of T cells. These findings demonstrate that the specificity of individual T cell clonotypes arises not only from TCR residues that create direct contacts with the pMHC, but also from a collection of indirect effects that modulate how TCR residues are used to bind pMHC.


  • Organizational Affiliation

    Department of Pathology, University of Massachusetts Medical School, Worcester, MA 01655; and.


Macromolecules
Find similar proteins by:  (by identity cutoff)  |  3D Structure
Entity ID: 1
MoleculeChains Sequence LengthOrganismDetailsImage
TRA protein
A, E
206Homo sapiensMutation(s): 0 
Gene Names: TRA@
Entity Groups  
Sequence Clusters30% Identity50% Identity70% Identity90% Identity95% Identity100% Identity
Sequence Annotations
Expand
  • Reference Sequence
Find similar proteins by:  (by identity cutoff)  |  3D Structure
Entity ID: 2
MoleculeChains Sequence LengthOrganismDetailsImage
Human nkt tcr beta chain
B, F
241Homo sapiensMutation(s): 0 
Gene Names: B2MHDCMA22P
Entity Groups  
Sequence Clusters30% Identity50% Identity70% Identity90% Identity95% Identity100% Identity
Sequence Annotations
Expand
  • Reference Sequence
Find similar proteins by:  (by identity cutoff)  |  3D Structure
Entity ID: 3
MoleculeChains Sequence LengthOrganismDetailsImage
H-2 class II histocompatibility antigen, A-B alpha chain
C, G
182Mus musculusMutation(s): 0 
Gene Names: H2-Aa
UniProt
Find proteins for P14434 (Mus musculus)
Explore P14434 
Go to UniProtKB:  P14434
Entity Groups  
Sequence Clusters30% Identity50% Identity70% Identity90% Identity95% Identity100% Identity
UniProt GroupP14434
Sequence Annotations
Expand
  • Reference Sequence
Find similar proteins by:  (by identity cutoff)  |  3D Structure
Entity ID: 4
MoleculeChains Sequence LengthOrganismDetailsImage
protein of 3K peptide (FEAQKAKANKAVD),Linker region - GGGGSLVPRGSGGGG,H-2 class II histocompatibility antigen, A beta chain,H-2 class II histocompatibility antigen, A beta chain
D, H
217Mus musculusMutation(s): 0 
UniProt
Find proteins for P14483 (Mus musculus)
Explore P14483 
Go to UniProtKB:  P14483
Entity Groups  
Sequence Clusters30% Identity50% Identity70% Identity90% Identity95% Identity100% Identity
UniProt GroupP14483
Sequence Annotations
Expand
  • Reference Sequence
Experimental Data & Validation

Experimental Data

  • Method: X-RAY DIFFRACTION
  • Resolution: 3.26 Å
  • R-Value Free: 0.236 
  • R-Value Work: 0.186 
  • R-Value Observed: 0.189 
  • Space Group: P 1 21 1
Unit Cell:
Length ( Å )Angle ( ˚ )
a = 66.007α = 90
b = 74.142β = 92
c = 259.289γ = 90
Software Package:
Software NamePurpose
PHASERphasing
PHENIXrefinement
PDB_EXTRACTdata extraction
Cootmodel building
HKLdata reduction

Structure Validation

View Full Validation Report


Entry History & Funding Information

Deposition Data


Funding OrganizationLocationGrant Number
National Institutes of HealthUnited StatesR01-DK095077
National Institutes of HealthUnited StatesR01-AI-38996
National Institutes of HealthUnited StatesT32-AI-007349

Revision History  (Full details and data files)

  • Version 1.0: 2014-05-28
    Type: Initial release
  • Version 1.1: 2014-06-25
    Changes: Database references
  • Version 1.2: 2014-12-24
    Changes: Database references
  • Version 1.3: 2018-01-31
    Changes: Author supporting evidence
  • Version 1.4: 2023-12-20
    Changes: Data collection, Database references, Refinement description