4OY2

Crystal structure of TAF1-TAF7, a TFIID subcomplex


Experimental Data Snapshot

  • Method: X-RAY DIFFRACTION
  • Resolution: 2.90 Å
  • R-Value Free: 0.243 
  • R-Value Work: 0.209 
  • R-Value Observed: 0.210 

wwPDB Validation   3D Report Full Report


This is version 1.5 of the entry. See complete history


Literature

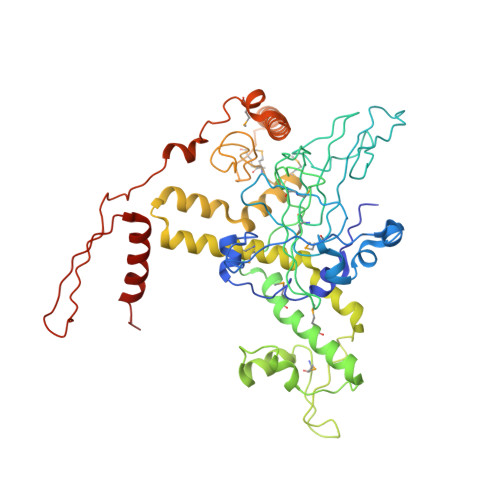
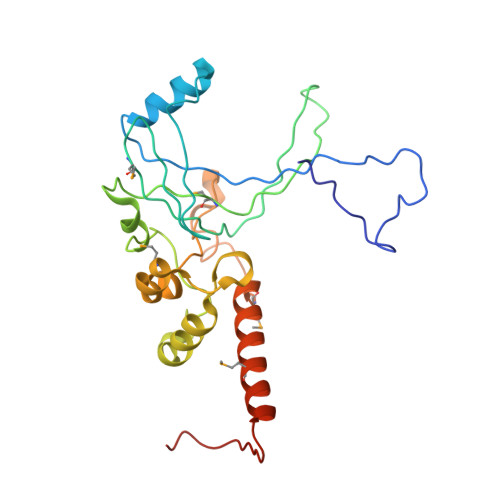
Structural and functional insight into TAF1-TAF7, a subcomplex of transcription factor II D.

Bhattacharya, S.Lou, X.Hwang, P.Rajashankar, K.R.Wang, X.Gustafsson, J.-A.Fletterick, R.J.Jacobson, R.H.Webb, P.

(2014) Proc Natl Acad Sci U S A 111: 9103-9108

  • DOI: https://doi.org/10.1073/pnas.1408293111
  • Primary Citation of Related Structures:  
    4OY2

  • PubMed Abstract: 

    Transcription factor II D (TFIID) is a multiprotein complex that nucleates formation of the basal transcription machinery. TATA binding protein-associated factors 1 and 7 (TAF1 and TAF7), two subunits of TFIID, are integral to the regulation of eukaryotic transcription initiation and play key roles in preinitiation complex (PIC) assembly. Current models suggest that TAF7 acts as a dissociable inhibitor of TAF1 histone acetyltransferase activity and that this event ensures appropriate assembly of the RNA polymerase II-mediated PIC before transcriptional initiation. Here, we report the 3D structure of a complex of yeast TAF1 with TAF7 at 2.9 Å resolution. The structure displays novel architecture and is characterized by a large predominantly hydrophobic heterodimer interface and extensive cofolding of TAF subunits. There are no obvious similarities between TAF1 and known histone acetyltransferases. Instead, the surface of the TAF1-TAF7 complex contains two prominent conserved surface pockets, one of which binds selectively to an inhibitory trimethylated histone H3 mark on Lys27 in a manner that is also regulated by phosphorylation at the neighboring H3 serine. Our findings could point toward novel roles for the TAF1-TAF7 complex in regulation of PIC assembly via reading epigenetic histone marks.


  • Organizational Affiliation

    Genomic Medicine Program, Houston Methodist Research Institute, Houston, TX 77030;


Macromolecules
Find similar proteins by:  (by identity cutoff)  |  3D Structure
Entity ID: 1
MoleculeChains Sequence LengthOrganismDetailsImage
Transcription initiation factor TFIID subunit 1A,
B [auth C],
C [auth E]
506Saccharomyces cerevisiae S288CMutation(s): 0 
Gene Names: G9374P46677TAF1TAF130TAF145YGR274C
EC: 2.3.1.48
UniProt
Find proteins for P46677 (Saccharomyces cerevisiae (strain ATCC 204508 / S288c))
Explore P46677 
Go to UniProtKB:  P46677
Entity Groups  
Sequence Clusters30% Identity50% Identity70% Identity90% Identity95% Identity100% Identity
UniProt GroupP46677
Sequence Annotations
Expand
  • Reference Sequence
Find similar proteins by:  (by identity cutoff)  |  3D Structure
Entity ID: 2
MoleculeChains Sequence LengthOrganismDetailsImage
Transcription initiation factor TFIID subunit 7D [auth B],
E [auth D],
F
235Saccharomyces cerevisiae S288CMutation(s): 0 
Gene Names: Q05021TAF67TAF7YM9959.09CYMR227C
UniProt
Find proteins for Q05021 (Saccharomyces cerevisiae (strain ATCC 204508 / S288c))
Explore Q05021 
Go to UniProtKB:  Q05021
Entity Groups  
Sequence Clusters30% Identity50% Identity70% Identity90% Identity95% Identity100% Identity
UniProt GroupQ05021
Sequence Annotations
Expand
  • Reference Sequence
Small Molecules
Ligands 2 Unique
IDChains Name / Formula / InChI Key2D Diagram3D Interactions
TRS
Query on TRS

Download Ideal Coordinates CCD File 
H [auth D]2-AMINO-2-HYDROXYMETHYL-PROPANE-1,3-DIOL
C4 H12 N O3
LENZDBCJOHFCAS-UHFFFAOYSA-O
ZN
Query on ZN

Download Ideal Coordinates CCD File 
G [auth A]ZINC ION
Zn
PTFCDOFLOPIGGS-UHFFFAOYSA-N
Modified Residues  1 Unique
IDChains TypeFormula2D DiagramParent
MSE
Query on MSE
A,
B [auth C],
C [auth E]
L-PEPTIDE LINKINGC5 H11 N O2 SeMET
Experimental Data & Validation

Experimental Data

  • Method: X-RAY DIFFRACTION
  • Resolution: 2.90 Å
  • R-Value Free: 0.243 
  • R-Value Work: 0.209 
  • R-Value Observed: 0.210 
  • Space Group: P 21 21 21
Unit Cell:
Length ( Å )Angle ( ˚ )
a = 122.215α = 90
b = 123.66β = 90
c = 229.61γ = 90
Software Package:
Software NamePurpose
HKL-2000data collection
PHENIXphasing
PDB_EXTRACTdata extraction
PHENIXrefinement

Structure Validation

View Full Validation Report


Entry History & Funding Information

Deposition Data


Funding OrganizationLocationGrant Number
National Institutes of Health/National Institute of Diabetes and Digestive and Kidney Disease (NIH/NIDDK)United StatesDK41482

Revision History  (Full details and data files)

  • Version 1.0: 2014-06-25
    Type: Initial release
  • Version 1.1: 2014-07-23
    Changes: Structure summary
  • Version 1.2: 2014-10-01
    Changes: Database references
  • Version 1.3: 2017-09-06
    Changes: Author supporting evidence, Database references, Derived calculations, Other, Source and taxonomy
  • Version 1.4: 2019-12-25
    Changes: Author supporting evidence
  • Version 1.5: 2023-12-27
    Changes: Data collection, Database references, Refinement description