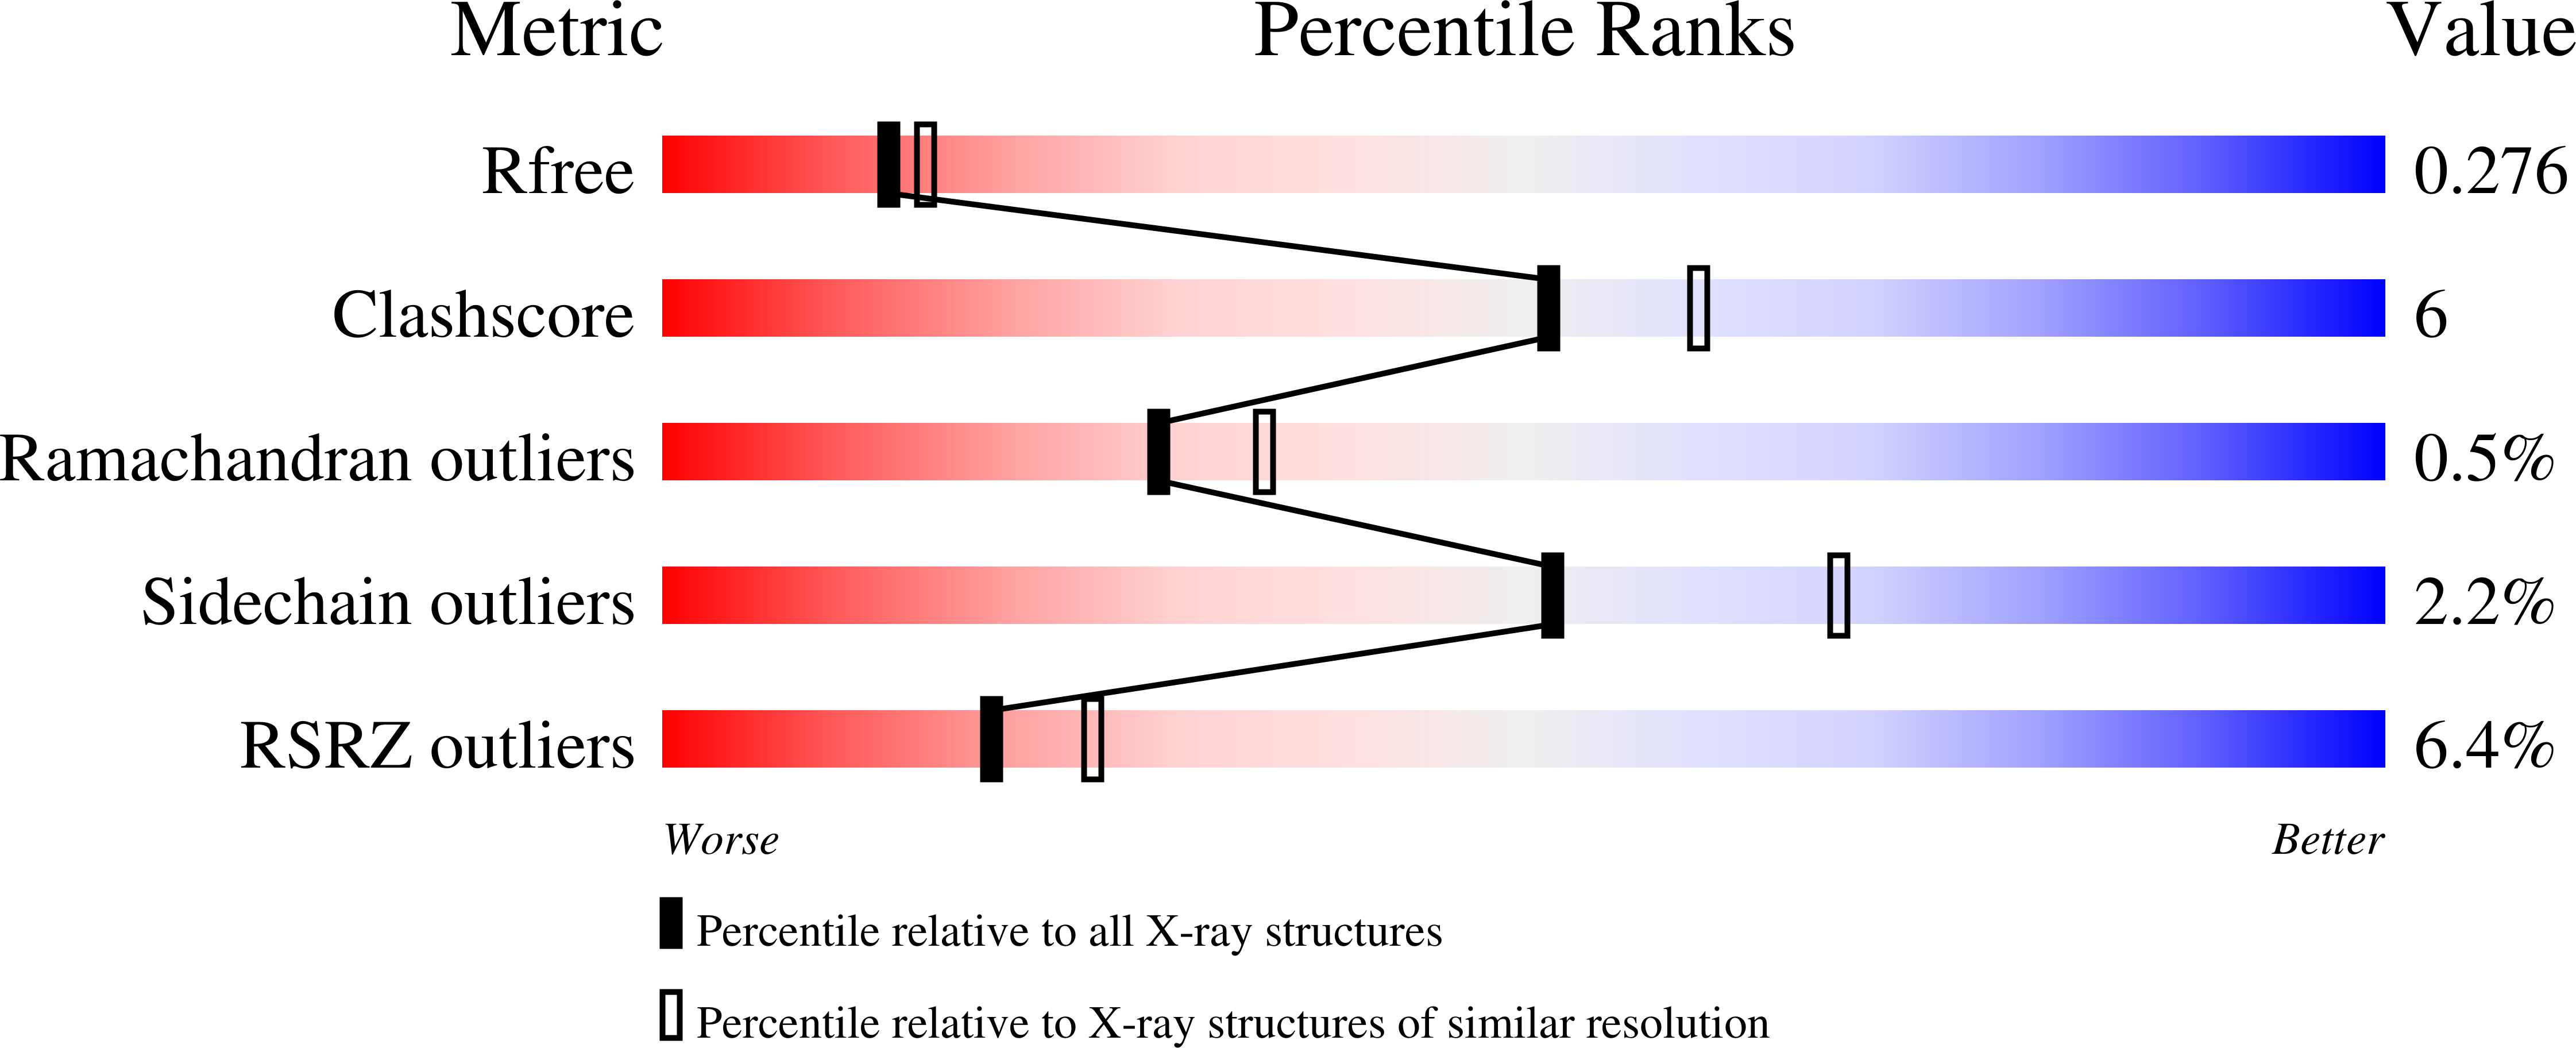
4UWB

Fibroblast growth factor receptor 1 kinase in complex with JK-P5


Experimental Data Snapshot

  • Method: X-RAY DIFFRACTION
  • Resolution: 2.31 Å
  • R-Value Free: 0.272 
  • R-Value Work: 0.229 
  • R-Value Observed: 0.231 

wwPDB Validation   3D Report Full Report


Ligand Structure Quality Assessment 


This is version 1.4 of the entry. See complete history


Literature

Validation of IMS-MS as a screening tool to identify type II kinase inhibitors of FGFR1 kinase.

Beeston, H.S.Klein, T.Norman, R.A.Tucker, J.A.Anderson, M.Ashcroft, A.E.Holdgate, G.A.

(2021) Rapid Commun Mass Spectrom : e9130-e9130

  • DOI: https://doi.org/10.1002/rcm.9130
  • Primary Citation of Related Structures:  
    4UWB, 4UWC

  • PubMed Abstract: 

    The protein kinase FGFR1 regulates cellular processes in human development. As over-activity of FGFR1 is implicated with cancer, effective inhibitors are in demand. Type I inhibitors, which bind to the active form of FGFR1, are less effective than type II inhibitors, which bind to the inactive form. Screening to distinguish between type I and type II inhibitors is required. X-ray crystallography was used to indicate whether a range of potential inhibitors bind to the active or inactive FGFR1 kinase conformation. The binding affinity of each ligand to FGFR1 was measured using biochemical methods. Electrospray ionisation - ion mobility spectrometry - mass spectrometry (ESI-IMS-MS) in conjunction with collision-induced protein unfolding generated a conformational profile of each FGFR1-ligand complex. The results indicate that the protein's conformational profile depends on whether the inhibitor is type I or type II. X-ray crystallography confirmed which of the kinase inhibitors bind to the active or inactive form of FGFR1 kinase. Collision-induced unfolding combined with ESI-IMS-MS showed distinct differences in the FGFR1 folding landscape for type I and type II inhibitors. Biochemical studies indicated a similar range of FGFR1 affinities for both types of inhibitors, thus providing confidence that the conformational variations detected using ESI-IMS-MS can be interpretated unequivocally and that this is an effective screening method. A robust ESI-IMS-MS method has been implemented to distinguish between the binding mode of type I and type II inhibitors by monitoring the conformational unfolding profile of FGFR1. This rapid method requires low sample concentrations and could be used as a high-throughput screening technique for the characterisation of novel kinase inhibitors.


  • Organizational Affiliation

    Astbury Centre for Structural Molecular Biology & Faculty of Biological Sciences, University of Leeds, Leeds, LS2 9JT, UK.


Macromolecules
Find similar proteins by:  (by identity cutoff)  |  3D Structure
Entity ID: 1
MoleculeChains Sequence LengthOrganismDetailsImage
FIBROBLAST GROWTH FACTOR RECEPTOR 1
A, B
309Homo sapiensMutation(s): 2 
EC: 2.7.10.1
UniProt & NIH Common Fund Data Resources
Find proteins for P11362 (Homo sapiens)
Explore P11362 
Go to UniProtKB:  P11362
PHAROS:  P11362
GTEx:  ENSG00000077782 
Entity Groups  
Sequence Clusters30% Identity50% Identity70% Identity90% Identity95% Identity100% Identity
UniProt GroupP11362
Sequence Annotations
Expand
  • Reference Sequence
Small Molecules
Ligands 3 Unique
IDChains Name / Formula / InChI Key2D Diagram3D Interactions
JVT
Query on JVT

Download Ideal Coordinates CCD File 
F [auth A],
J [auth B]
N-[4-(4-methylpiperazin-1-yl)phenyl]-1H-indazole-3-carboxamide
C19 H21 N5 O
NZDNAXLFPOOOJE-UHFFFAOYSA-N
SO4
Query on SO4

Download Ideal Coordinates CCD File 
G [auth A],
K [auth B]
SULFATE ION
O4 S
QAOWNCQODCNURD-UHFFFAOYSA-L
EDO
Query on EDO

Download Ideal Coordinates CCD File 
C [auth A],
D [auth A],
E [auth A],
H [auth B],
I [auth B]
1,2-ETHANEDIOL
C2 H6 O2
LYCAIKOWRPUZTN-UHFFFAOYSA-N
Experimental Data & Validation

Experimental Data

  • Method: X-RAY DIFFRACTION
  • Resolution: 2.31 Å
  • R-Value Free: 0.272 
  • R-Value Work: 0.229 
  • R-Value Observed: 0.231 
  • Space Group: C 1 2 1
Unit Cell:
Length ( Å )Angle ( ˚ )
a = 208.623α = 90
b = 57.323β = 107.58
c = 65.628γ = 90
Software Package:
Software NamePurpose
REFMACrefinement
autoPROCdata reduction
XDSdata reduction
SCALAdata scaling
PHASERphasing

Structure Validation

View Full Validation Report


Ligand Structure Quality Assessment 


Entry History 

Deposition Data

Revision History  (Full details and data files)

  • Version 1.0: 2015-09-02
    Type: Initial release
  • Version 1.1: 2017-03-29
    Changes: Other
  • Version 1.2: 2018-04-04
    Changes: Data collection
  • Version 1.3: 2021-06-16
    Changes: Database references, Derived calculations, Other, Refinement description
  • Version 1.4: 2024-05-01
    Changes: Data collection, Database references, Refinement description