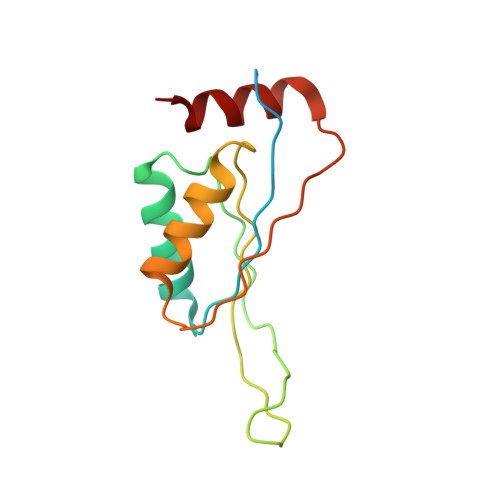
Crystal structure of divalent ion tolerance protein CutA1 from Ehrlichia chaffeensis
Seattle Structural Genomics Center for Infectious Disease (SSGCID), Abendroth, J., Sankaran, B., Buchko, G.W., Craig, T., Lorimer, D., Edwards, T.E.To be published.