4C1N

Corrinoid protein reactivation complex with activator


Experimental Data Snapshot

  • Method: X-RAY DIFFRACTION
  • Resolution: 2.53 Å
  • R-Value Free: 0.243 
  • R-Value Work: 0.191 
  • R-Value Observed: 0.193 

wwPDB Validation   3D Report Full Report


Ligand Structure Quality Assessment 


This is version 1.1 of the entry. See complete history


Literature

ATP-Induced Electron Transfer by Redox-Selective Partner Recognition

Hennig, S.E.Goetzl, S.Jeoung, J.H.Bommer, M.Lendzian, F.Hildebrandt, P.Dobbek, H.

(2014) Nat Commun 5: 4626

  • DOI: https://doi.org/10.1038/ncomms5626
  • Primary Citation of Related Structures:  
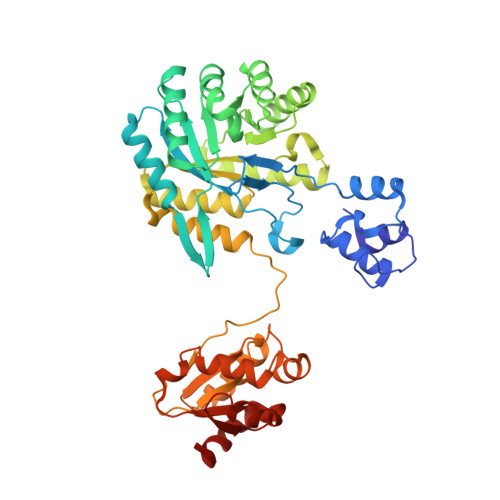
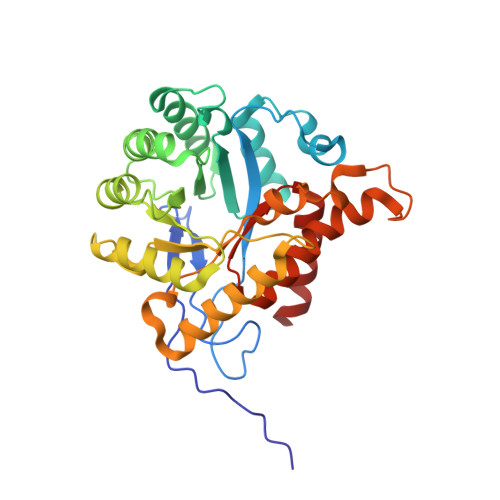
    4C1N

  • PubMed Abstract: 

    Thermodynamically unfavourable electron transfers are enabled by coupling to an energy-supplying reaction. How the energy is transduced from the exergonic to the endergonic process is largely unknown. Here we provide the structural basis for an energy transduction process in the reductive activation of B12-dependent methyltransferases. The transfer of one electron from an activating enzyme to the cobalamin cofactor is energetically uphill and relies on coupling to an ATPase reaction. Our results demonstrate that the key to coupling is, besides the oxidation state-dependent complex formation, the conformational gating of the electron transfer. Complex formation induces a substitution of the ligand at the electron-accepting Co ion. Addition of ATP initiates electron transfer by provoking conformational changes that destabilize the complex. We show how remodelling of the electron-accepting Co(2+) promotes ATP-dependent electron transfer; an efficient strategy not seen in other electron-transferring ATPases.


  • Organizational Affiliation

    Humboldt Universität zu Berlin, Institut für Biologie, Strukturbiologie/Biochemie, Unter den Linden 6, 10099 Berlin, Germany.


Macromolecules
Find similar proteins by:  (by identity cutoff)  |  3D Structure
Entity ID: 1
MoleculeChains Sequence LengthOrganismDetailsImage
CARBON MONOXIDE DEHYDROGENASE CORRINOID/IRON-SULFUR PROTEIN, GAMMA SUBUNIT
A, C, E, G
442Carboxydothermus hydrogenoformansMutation(s): 0 
UniProt
Find proteins for Q3ACS3 (Carboxydothermus hydrogenoformans (strain ATCC BAA-161 / DSM 6008 / Z-2901))
Explore Q3ACS3 
Go to UniProtKB:  Q3ACS3
Entity Groups  
Sequence Clusters30% Identity50% Identity70% Identity90% Identity95% Identity100% Identity
UniProt GroupQ3ACS3
Sequence Annotations
Expand
  • Reference Sequence
Find similar proteins by:  (by identity cutoff)  |  3D Structure
Entity ID: 2
MoleculeChains Sequence LengthOrganismDetailsImage
CO DEHYDROGENASE/ACETYL-COA SYNTHASE, IRON-SULFUR PROTEIN
B, D, F, H
309Carboxydothermus hydrogenoformansMutation(s): 0 
UniProt
Find proteins for Q3ACS0 (Carboxydothermus hydrogenoformans (strain ATCC BAA-161 / DSM 6008 / Z-2901))
Explore Q3ACS0 
Go to UniProtKB:  Q3ACS0
Entity Groups  
Sequence Clusters30% Identity50% Identity70% Identity90% Identity95% Identity100% Identity
UniProt GroupQ3ACS0
Sequence Annotations
Expand
  • Reference Sequence
Find similar proteins by:  (by identity cutoff)  |  3D Structure
Entity ID: 3
MoleculeChains Sequence LengthOrganismDetailsImage
IRON-SULFUR CLUSTER BINDING PROTEINI,
J,
L [auth X]
509Carboxydothermus hydrogenoformansMutation(s): 0 
UniProt
Find proteins for Q3ACS2 (Carboxydothermus hydrogenoformans (strain ATCC BAA-161 / DSM 6008 / Z-2901))
Explore Q3ACS2 
Go to UniProtKB:  Q3ACS2
Entity Groups  
Sequence Clusters30% Identity50% Identity70% Identity90% Identity95% Identity100% Identity
UniProt GroupQ3ACS2
Sequence Annotations
Expand
  • Reference Sequence
Find similar proteins by:  (by identity cutoff)  |  3D Structure
Entity ID: 4
MoleculeChains Sequence LengthOrganismDetailsImage
IRON-SULFUR CLUSTER BINDING PROTEIN510Carboxydothermus hydrogenoformansMutation(s): 0 
UniProt
Find proteins for Q3ACS2 (Carboxydothermus hydrogenoformans (strain ATCC BAA-161 / DSM 6008 / Z-2901))
Explore Q3ACS2 
Go to UniProtKB:  Q3ACS2
Entity Groups  
Sequence Clusters30% Identity50% Identity70% Identity90% Identity95% Identity100% Identity
UniProt GroupQ3ACS2
Sequence Annotations
Expand
  • Reference Sequence
Experimental Data & Validation

Experimental Data

  • Method: X-RAY DIFFRACTION
  • Resolution: 2.53 Å
  • R-Value Free: 0.243 
  • R-Value Work: 0.191 
  • R-Value Observed: 0.193 
  • Space Group: P 1
Unit Cell:
Length ( Å )Angle ( ˚ )
a = 67.134α = 77.61
b = 128.175β = 82.25
c = 163.366γ = 88.76
Software Package:
Software NamePurpose
PHENIXrefinement
PHENIXphasing

Structure Validation

View Full Validation Report


Ligand Structure Quality Assessment 


Entry History 

Deposition Data

Revision History  (Full details and data files)

  • Version 1.0: 2014-08-13
    Type: Initial release
  • Version 1.1: 2014-08-20
    Changes: Database references