3L6F

Structure of MHC class II molecule HLA-DR1 complexed with phosphopeptide MART-1


Experimental Data Snapshot

  • Method: X-RAY DIFFRACTION
  • Resolution: 2.10 Å
  • R-Value Free: 0.249 
  • R-Value Work: 0.212 

wwPDB Validation   3D Report Full Report


This is version 1.2 of the entry. See complete history


Literature

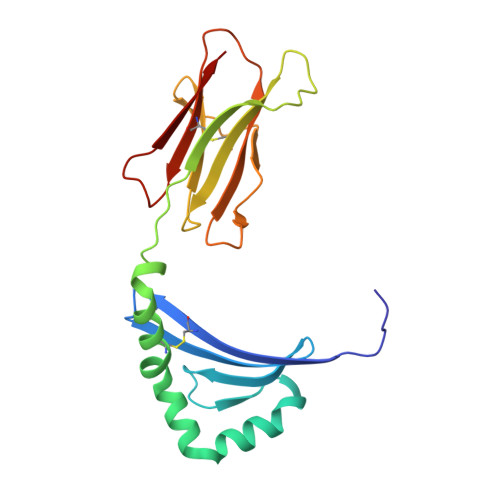
Structural Basis for the Presentation of Tumor-Associated MHC Class II-Restricted Phosphopeptides to CD4(+) T Cells.

Li, Y.Depontieu, F.R.Sidney, J.Salay, T.M.Engelhard, V.H.Hunt, D.F.Sette, A.Topalian, S.L.Mariuzza, R.A.

(2010) J Mol Biol 399: 596-603

  • DOI: https://doi.org/10.1016/j.jmb.2010.04.037
  • Primary Citation of Related Structures:  
    3L6F

  • PubMed Abstract: 

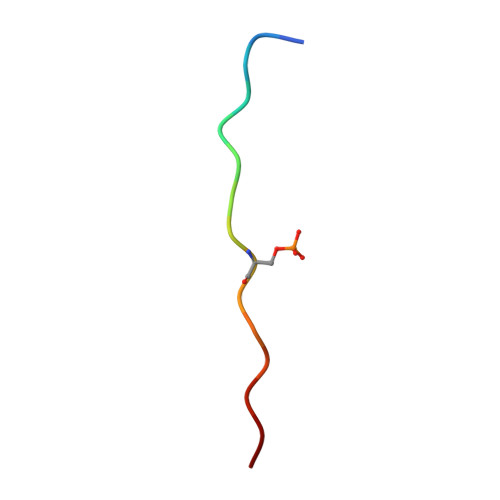
    Dysregulated protein phosphorylation is a hallmark of malignant transformation. Transformation can generate major histocompatibility complex (MHC)-bound phosphopeptides that are differentially displayed on tumor cells for specific recognition by T cells. To understand how phosphorylation alters the antigenic identity of self-peptides and how MHC class II molecules present phosphopeptides for CD4(+) T-cell recognition, we determined the crystal structure of a phosphopeptide derived from melanoma antigen recognized by T cells-1 (pMART-1), selectively expressed by human melanomas, in complex with HLA-DR1. The structure revealed that the phosphate moiety attached to the serine residue at position P5 of pMART-1 is available for direct interactions with T-cell receptor (TCR) and that the peptide N-terminus adopts an unusual conformation orienting it toward TCR. This structure, combined with measurements of peptide affinity for HLA-DR1 and of peptide-MHC recognition by pMART-1-specific T cells, suggests that TCR recognition is focused on the N-terminal portion of pMART-1. This recognition mode appears to be distinct from that of foreign antigen complexes but is remarkably reminiscent of the way autoreactive TCRs engage self- or altered self-peptides, consistent with the tolerogenic nature of tumor-host immune interactions.


  • Organizational Affiliation

    University of Maryland Institute for Bioscience and Biotechnology Research, W. M. Keck Laboratory for Structural Biology, Rockville, MD 20850, USA.


Macromolecules
Find similar proteins by:  (by identity cutoff)  |  3D Structure
Entity ID: 1
MoleculeChains Sequence LengthOrganismDetailsImage
HLA class II histocompatibility antigen, DR alpha chain182Homo sapiensMutation(s): 0 
Gene Names: HLA-DRAHLA-DRA1
UniProt & NIH Common Fund Data Resources
Find proteins for P01903 (Homo sapiens)
Explore P01903 
Go to UniProtKB:  P01903
PHAROS:  P01903
GTEx:  ENSG00000204287 
Entity Groups  
Sequence Clusters30% Identity50% Identity70% Identity90% Identity95% Identity100% Identity
UniProt GroupP01903
Sequence Annotations
Expand
  • Reference Sequence
Find similar proteins by:  (by identity cutoff)  |  3D Structure
Entity ID: 2
MoleculeChains Sequence LengthOrganismDetailsImage
HLA class II histocompatibility antigen, DRB1-1 beta chain193Homo sapiensMutation(s): 0 
Gene Names: HLA-DRB1
UniProt & NIH Common Fund Data Resources
Find proteins for P01911 (Homo sapiens)
Explore P01911 
Go to UniProtKB:  P01911
PHAROS:  P01911
GTEx:  ENSG00000196126 
Entity Groups  
Sequence Clusters30% Identity50% Identity70% Identity90% Identity95% Identity100% Identity
UniProt GroupP01911
Sequence Annotations
Expand
  • Reference Sequence

Find similar proteins by:  Sequence   |   3D Structure  

Entity ID: 3
MoleculeChains Sequence LengthOrganismDetailsImage
Melanoma antigen recognized by T-cells 115Homo sapiensMutation(s): 0 
UniProt & NIH Common Fund Data Resources
Find proteins for Q16655 (Homo sapiens)
Explore Q16655 
Go to UniProtKB:  Q16655
PHAROS:  Q16655
GTEx:  ENSG00000120215 
Entity Groups  
Sequence Clusters30% Identity50% Identity70% Identity90% Identity95% Identity100% Identity
UniProt GroupQ16655
Sequence Annotations
Expand
  • Reference Sequence
Small Molecules
Modified Residues  1 Unique
IDChains TypeFormula2D DiagramParent
SEP
Query on SEP
C
L-PEPTIDE LINKINGC3 H8 N O6 PSER
Experimental Data & Validation

Experimental Data

  • Method: X-RAY DIFFRACTION
  • Resolution: 2.10 Å
  • R-Value Free: 0.249 
  • R-Value Work: 0.212 
  • Space Group: P 21 21 2
Unit Cell:
Length ( Å )Angle ( ˚ )
a = 91.21α = 90
b = 135.45β = 90
c = 40.85γ = 90
Software Package:
Software NamePurpose
HKL-2000data collection
PHASESphasing
CNSrefinement
HKL-2000data reduction
HKL-2000data scaling

Structure Validation

View Full Validation Report


Entry History 

Deposition Data

Revision History  (Full details and data files)

  • Version 1.0: 2010-05-12
    Type: Initial release
  • Version 1.1: 2011-07-13
    Changes: Version format compliance
  • Version 1.2: 2023-09-06
    Changes: Data collection, Database references, Derived calculations, Refinement description