


Crystal Structure Analysis of Cell Division Protein
Kato, K., Ishido, T., Matsui, T., Yao, M.To be published.
Experimental Data Snapshot
Entity ID: 1 | |||||
|---|---|---|---|---|---|
| Molecule | Chains | Sequence Length | Organism | Details | Image |
| Cell division protein FtsA | 402 | Staphylococcus aureus subsp. aureus MW2 | Mutation(s): 0 Gene Names: ftsA, MW1068 | 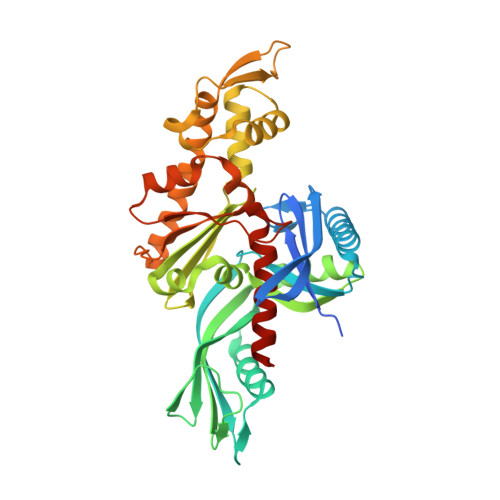 | |
UniProt | |||||
Find proteins for Q8NX33 (Staphylococcus aureus (strain MW2)) Explore Q8NX33 Go to UniProtKB: Q8NX33 | |||||
Entity Groups | |||||
| Sequence Clusters | 30% Identity50% Identity70% Identity90% Identity95% Identity100% Identity | ||||
| UniProt Group | Q8NX33 | ||||
Sequence AnnotationsExpand | |||||
| |||||
| Ligands 2 Unique | |||||
|---|---|---|---|---|---|
| ID | Chains | Name / Formula / InChI Key | 2D Diagram | 3D Interactions | |
| ATP Query on ATP | E [auth A], G [auth B], I [auth C], K [auth D] | ADENOSINE-5'-TRIPHOSPHATE C10 H16 N5 O13 P3 ZKHQWZAMYRWXGA-KQYNXXCUSA-N |  | ||
| MG Query on MG | F [auth A], H [auth B], J [auth C], L [auth D] | MAGNESIUM ION Mg JLVVSXFLKOJNIY-UHFFFAOYSA-N |  | ||
| Length ( Å ) | Angle ( ˚ ) |
|---|---|
| a = 106.032 | α = 90 |
| b = 70.628 | β = 108 |
| c = 120.676 | γ = 90 |
| Software Name | Purpose |
|---|---|
| XDS | data scaling |
| MOLREP | phasing |
| PHENIX | refinement |
| XDS | data reduction |
RCSB PDB (citation) is hosted by
RCSB PDB is a member of the

