2WBJ

TCR complex


Experimental Data Snapshot

  • Method: X-RAY DIFFRACTION
  • Resolution: 3.00 Å
  • R-Value Free: 0.288 
  • R-Value Work: 0.247 
  • R-Value Observed: 0.249 

wwPDB Validation   3D Report Full Report


Ligand Structure Quality Assessment 


This is version 2.1 of the entry. See complete history


Literature

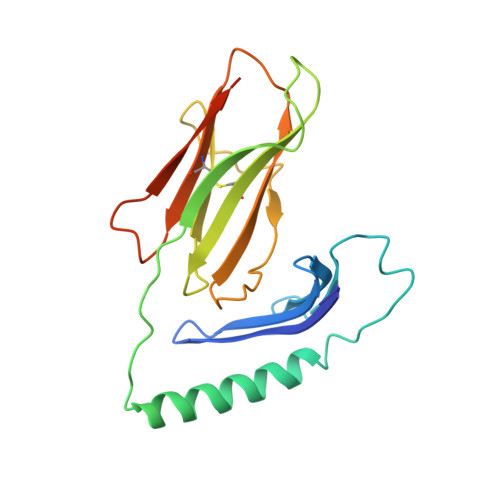
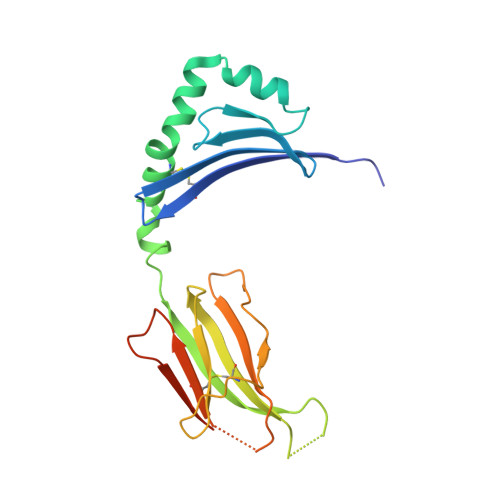
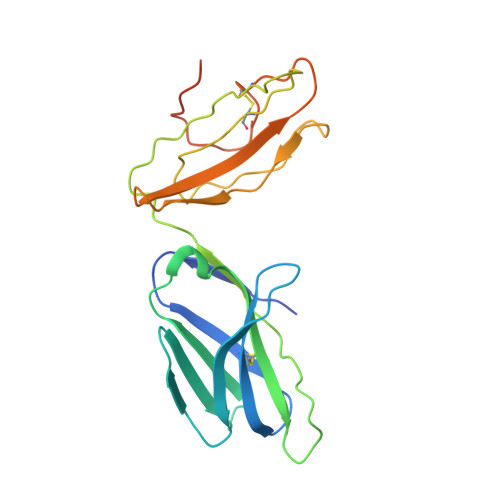
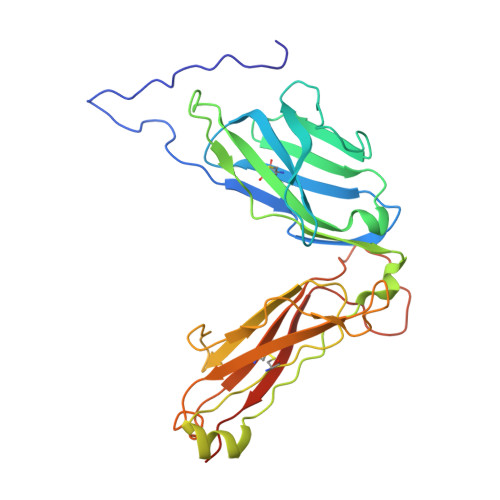
T Cell-Mediated Autoimmune Disease due to Low-Affinity Crossreactivity to Common Microbial Peptides.

Harkiolaki, M.Holmes, S.L.Svendsen, P.Gregersen, J.W.Jensen, L.T.Mcmahon, R.Friese, M.A.Van Boxel, G.Etzensperger, R.Tzartos, J.S.Kranc, K.Sainsbury, S.Harlos, K.Mellins, E.D.Palace, J.Esiri, M.M.Van Der Merwe, P.A.Jones, E.Y.Fugger, L.

(2009) Immunity 30: 348

  • DOI: https://doi.org/10.1016/j.immuni.2009.01.009
  • Primary Citation of Related Structures:  
    2WBJ

  • PubMed Abstract: 

    Environmental factors account for 75% of the risk of developing multiple sclerosis (MS). Numerous infections have been suspected as environmental disease triggers, but none of them has consistently been incriminated, and it is unclear how so many different infections may play a role. We show that a microbial peptide, common to several major classes of bacteria, can induce MS-like disease in humanized mice by crossreacting with a T cell receptor (TCR) that also recognizes a peptide from myelin basic protein, a candidate MS autoantigen. Structural analysis demonstrates this crossreactivity is due to structural mimicry of a binding hotspot shared by self and microbial antigens, rather than to degenerate TCR recognition. Biophysical studies reveal that the autoreactive TCR binding affinity is markedly lower for the microbial (mimicry) peptide than for the autoantigenic peptide. Thus, these data suggest a possible explanation for the difficulty in incriminating individual infections in the development of MS.


  • Organizational Affiliation

    Division of Structural Biology, Henry Wellcome Building for Genomic Medicine, University of Oxford, Roosevelt Drive, Oxford OX37BN, UK.


Macromolecules
Find similar proteins by:  (by identity cutoff)  |  3D Structure
Entity ID: 1
MoleculeChains Sequence LengthOrganismDetailsImage
HLA CLASS II HISTOCOMPATIBILITY ANTIGEN, DR ALPHA CHAIN
A, E
194Homo sapiensMutation(s): 0 
UniProt & NIH Common Fund Data Resources
Find proteins for P01903 (Homo sapiens)
Explore P01903 
Go to UniProtKB:  P01903
PHAROS:  P01903
GTEx:  ENSG00000204287 
Entity Groups  
Sequence Clusters30% Identity50% Identity70% Identity90% Identity95% Identity100% Identity
UniProt GroupP01903
Sequence Annotations
Expand
  • Reference Sequence
Find similar proteins by:  (by identity cutoff)  |  3D Structure
Entity ID: 2
MoleculeChains Sequence LengthOrganismDetailsImage
HLA CLASS II HISTOCOMPATIBILITY ANTIGEN, DRB1-15 BETA CHAIN
B, F
200Homo sapiensMutation(s): 0 
UniProt & NIH Common Fund Data Resources
Find proteins for P01911 (Homo sapiens)
Explore P01911 
Go to UniProtKB:  P01911
PHAROS:  P01911
GTEx:  ENSG00000196126 
Entity Groups  
Sequence Clusters30% Identity50% Identity70% Identity90% Identity95% Identity100% Identity
UniProt GroupP01911
Sequence Annotations
Expand
  • Reference Sequence
Find similar proteins by:  (by identity cutoff)  |  3D Structure
Entity ID: 3
MoleculeChains Sequence LengthOrganismDetailsImage
OB TCR
C, G
219Homo sapiensMutation(s): 0 
Entity Groups  
Sequence Clusters30% Identity50% Identity70% Identity90% Identity95% Identity100% Identity
Sequence Annotations
Expand
  • Reference Sequence
Find similar proteins by:  (by identity cutoff)  |  3D Structure
Entity ID: 4
MoleculeChains Sequence LengthOrganismDetailsImage
OB TCR
D, H
279Homo sapiensMutation(s): 0 
Entity Groups  
Sequence Clusters30% Identity50% Identity70% Identity90% Identity95% Identity100% Identity
Sequence Annotations
Expand
  • Reference Sequence
Oligosaccharides

Help

Entity ID: 5
MoleculeChains Length2D Diagram Glycosylation3D Interactions
alpha-D-mannopyranose-(1-3)-[alpha-D-mannopyranose-(1-6)]beta-D-mannopyranose-(1-4)-2-acetamido-2-deoxy-beta-D-glucopyranose-(1-4)-2-acetamido-2-deoxy-beta-D-glucopyranose
I
5N-Glycosylation
Glycosylation Resources
GlyTouCan:  G22768VO
GlyCosmos:  G22768VO
GlyGen:  G22768VO
Experimental Data & Validation

Experimental Data

  • Method: X-RAY DIFFRACTION
  • Resolution: 3.00 Å
  • R-Value Free: 0.288 
  • R-Value Work: 0.247 
  • R-Value Observed: 0.249 
  • Space Group: P 21 21 21
Unit Cell:
Length ( Å )Angle ( ˚ )
a = 109.706α = 90
b = 130.271β = 90
c = 180.22γ = 90
Software Package:
Software NamePurpose
REFMACrefinement
DENZOdata reduction
SCALEPACKdata scaling
AMoREphasing

Structure Validation

View Full Validation Report


Ligand Structure Quality Assessment 


Entry History 

Revision History  (Full details and data files)

  • Version 1.0: 2009-04-07
    Type: Initial release
  • Version 1.1: 2011-07-13
    Changes: Advisory, Refinement description, Version format compliance
  • Version 1.2: 2012-08-22
    Changes: Database references, Derived calculations
  • Version 2.0: 2020-07-29
    Type: Remediation
    Reason: Carbohydrate remediation
    Changes: Advisory, Atomic model, Data collection, Derived calculations, Other, Structure summary
  • Version 2.1: 2023-12-13
    Changes: Data collection, Database references, Refinement description, Structure summary