The Type I / Type II Cytochrome C(3) Complex: An Electron Transfer Link in the Hydrogen-Sulfate Reduction Pathway.
Pieulle, L., Morelli, X., Gallice, P., Lojou, E., Barbier, P., Czjzek, M., Bianco, P., Guerlesquin, F., Hatchikian, E.C.(2005) J Mol Biol 354: 73
- PubMed: 16226767
- DOI: https://doi.org/10.1016/j.jmb.2005.09.036
- Primary Citation of Related Structures:
2BQ4 - PubMed Abstract:
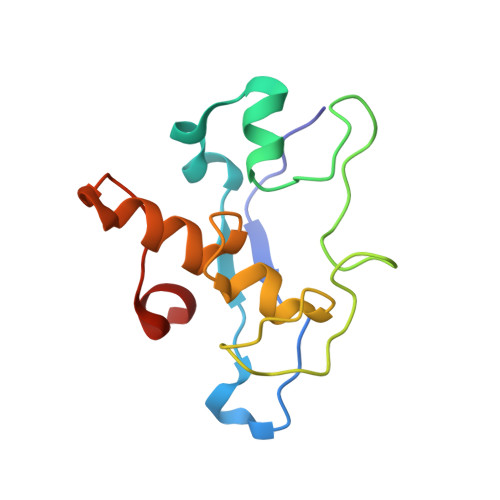
In Desulfovibrio metabolism, periplasmic hydrogen oxidation is coupled to cytoplasmic sulfate reduction via transmembrane electron transfer complexes. Type II tetraheme cytochrome c3 (TpII-c3), nine-heme cytochrome c (9HcA) and 16-heme cytochrome c (HmcA) are periplasmic proteins associated to these membrane-bound redox complexes and exhibit analogous physiological function. Type I tetraheme cytochrome c3 (TpI-c3) is thought to act as a mediator for electron transfer from hydrogenase to these multihemic cytochromes. In the present work we have investigated Desulfovibrio africanus (Da) and Desulfovibrio vulgaris Hildenborough (DvH) TpI-c3/TpII-c3 complexes. Comparative kinetic experiments of Da TpI-c3 and TpII-c3 using electrochemistry confirm that TpI-c3 is much more efficient than TpII-c3 as an electron acceptor from hydrogenase (second order rate constant k = 9 x 10(8) M(-1) s(-1), K(m) = 0.5 microM as compared to k = 1.7 x 10(7) M(-1) s(-1), K(m) = 40 microM, for TpI-c3 and TpII-c3, respectively). The Da TpI-c3/TpII-c3 complex was characterized at low ionic strength by gel filtration, analytical ultracentrifugation and cross-linking experiments. The thermodynamic parameters were determined by isothermal calorimetry titrations. The formation of the complex is mainly driven by a positive entropy change (deltaS = 137(+/-7) J mol(-1) K(-1) and deltaH = 5.1(+/-1.3) kJ mol(-1)) and the value for the association constant is found to be (2.2(+/-0.5)) x 10(6) M(-1) at pH 5.5. Our thermodynamic results reveal that the net increase in enthalpy and entropy is dominantly produced by proton release in combination with water molecule exclusion. Electrostatic forces play an important role in stabilizing the complex between the two proteins, since no complex formation is detected at high ionic strength. The crystal structure of Da TpI-c3 has been solved at 1.5 angstroms resolution and structural models of the complex have been obtained by NMR and docking experiments. Similar experiments have been carried out on the DvH TpI-c3/TpII-c3 complex. In both complexes, heme IV of TpI-c3 faces heme I of TpII-c3 involving basic residues of TpI-c3 and acidic residues of TpII-c3. A secondary interacting site has been observed in the two complexes, involving heme II of Da TpII-c3 and heme III of DvH TpI-c3 giving rise to a TpI-c3/TpII-c3 molar ratio of 2:1 and 1:2 for Da and DvH complexes, respectively. The physiological significance of these alternative sites in multiheme cytochromes c is discussed.
Organizational Affiliation:
Unité de Bioénergétique et Ingéniérie des Protéines, Institut de Biologie Structurale et Microbiologie, CNRS, 31 chemin Joseph-Aiguier, 13402 Marseille Cedex 20, France.