2A48

Crystal structure of amFP486 E150Q


Experimental Data Snapshot

  • Method: X-RAY DIFFRACTION
  • Resolution: 2.00 Å
  • R-Value Free: 0.249 
  • R-Value Work: 0.180 
  • R-Value Observed: 0.181 

wwPDB Validation   3D Report Full Report


This is version 1.6 of the entry. See complete history


Literature

Crystal structures and mutational analysis of amFP486, a cyan fluorescent protein from Anemonia majano

Henderson, J.N.Remington, S.J.

(2005) Proc Natl Acad Sci U S A 102: 12712-12717

  • DOI: https://doi.org/10.1073/pnas.0502250102
  • Primary Citation of Related Structures:  
    2A46, 2A47, 2A48

  • PubMed Abstract: 

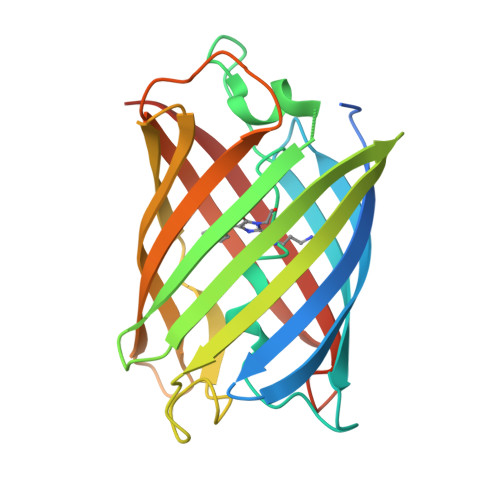
    Fluorescent proteins isolated from coral reef organisms can be roughly grouped into four color classes by emission, cyan, green, yellow, and red. To gain insight into the structural basis for cyan emission, the crystal structure of amFP486 (lambda(em)max = 486 nm) was determined by molecular replacement, and the model was refined at 1.65-A resolution. The electron density map reveals a chromophore formed from the tripeptide sequence -K-Y-G- that is indistinguishable from that of GFP (lambda(em)max = 509 nm). However, the chromophore environment closely parallels those of the yellow- and red-shifted homologs zFP538, DsRed, and eqFP611. Mutagenesis was performed for Glu-150, Ala-165, His-199, and Glu-217, which are immediately adjacent to the chromophore. His-199 and Ala-165 are key side chains responsible for the blue shift, presumably by localizing chromophore charge density on the phenolate moiety. Furthermore, in the H199T mutant the fluorescence quantum yield is reduced by a factor of approximately 110. The crystal structures of H199T (lambda(em)max = 515 nm) and E150Q (lambda(em)max = 506 nm) were determined. Remarkably, the H199T structure reveals that the stacking interaction of His-199 with the chromophore also controls the fluorescence efficiency, because the chromophore is statistically distributed in a 1:1 ratio between cis (fluorescent) and trans (nonfluorescent) conformations.


  • Organizational Affiliation

    Department of Physics and Institute of Molecular Biology, University of Oregon, Eugene, OR 97403, USA.


Macromolecules
Find similar proteins by:  (by identity cutoff)  |  3D Structure
Entity ID: 1
MoleculeChains Sequence LengthOrganismDetailsImage
GFP-like fluorescent chromoprotein amFP486238Anemonia manjanoMutation(s): 2 
UniProt
Find proteins for Q9U6Y6 (Anemonia manjano)
Explore Q9U6Y6 
Go to UniProtKB:  Q9U6Y6
Entity Groups  
Sequence Clusters30% Identity50% Identity70% Identity90% Identity95% Identity100% Identity
UniProt GroupQ9U6Y6
Sequence Annotations
Expand
  • Reference Sequence
Small Molecules
Modified Residues  1 Unique
IDChains TypeFormula2D DiagramParent
CR7
Query on CR7
A
L-PEPTIDE LINKINGC17 H22 N4 O4LYS, TYR, GLY
Experimental Data & Validation

Experimental Data

  • Method: X-RAY DIFFRACTION
  • Resolution: 2.00 Å
  • R-Value Free: 0.249 
  • R-Value Work: 0.180 
  • R-Value Observed: 0.181 
  • Space Group: I 41 2 2
Unit Cell:
Length ( Å )Angle ( ˚ )
a = 113.888α = 90
b = 113.888β = 90
c = 82.625γ = 90
Software Package:
Software NamePurpose
DENZOdata reduction
SCALEPACKdata scaling
EPMRphasing
TNTrefinement
PDB_EXTRACTdata extraction
HKL-2000data reduction

Structure Validation

View Full Validation Report


Entry History 

Deposition Data

Revision History  (Full details and data files)

  • Version 1.0: 2005-08-16
    Type: Initial release
  • Version 1.1: 2008-04-30
    Changes: Version format compliance
  • Version 1.2: 2011-07-13
    Changes: Version format compliance
  • Version 1.3: 2017-10-11
    Changes: Refinement description
  • Version 1.4: 2021-10-20
    Changes: Database references, Derived calculations
  • Version 1.5: 2023-08-23
    Changes: Data collection, Refinement description
  • Version 1.6: 2023-11-15
    Changes: Data collection, Derived calculations