2P8V

Crystal structure of human Homer3 EVH1 domain


Experimental Data Snapshot

  • Method: X-RAY DIFFRACTION
  • Resolution: 1.85 Å
  • R-Value Free: 0.264 
  • R-Value Work: 0.222 

wwPDB Validation   3D Report Full Report


This is version 1.3 of the entry. See complete history


Literature

NFAT binding and regulation of T cell activation by the cytoplasmic scaffolding Homer proteins.

Huang, G.N.Huso, D.L.Bouyain, S.Tu, J.McCorkell, K.A.May, M.J.Zhu, Y.Lutz, M.Collins, S.Dehoff, M.Kang, S.Whartenby, K.Powell, J.Leahy, D.Worley, P.F.

(2008) Science 319: 476-481

  • DOI: https://doi.org/10.1126/science.1151227
  • Primary Citation of Related Structures:  
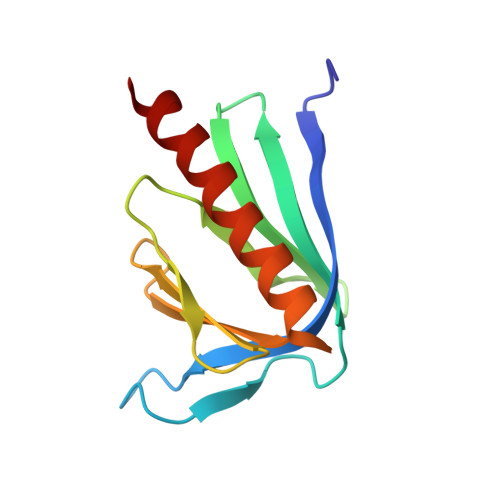
    2P8V

  • PubMed Abstract: 

    T cell receptor (TCR) and costimulatory receptor (CD28) signals cooperate in activating T cells, although understanding of how these pathways are themselves regulated is incomplete. We found that Homer2 and Homer3, members of the Homer family of cytoplasmic scaffolding proteins, are negative regulators of T cell activation. This is achieved through binding of nuclear factor of activated T cells (NFAT) and by competing with calcineurin. Homer-NFAT binding was also antagonized by active serine-threonine kinase AKT, thereby enhancing TCR signaling via calcineurin-dependent dephosphorylation of NFAT. This corresponded with changes in cytokine expression and an increase in effector-memory T cell populations in Homer-deficient mice, which also developed autoimmune-like pathology. These results demonstrate a further means by which costimulatory signals are regulated to control self-reactivity.


  • Organizational Affiliation

    Program in Biochemistry, Cellular and Molecular Biology, Johns Hopkins University School of Medicine, Baltimore, MD 21205, USA.


Macromolecules
Find similar proteins by:  (by identity cutoff)  |  3D Structure
Entity ID: 1
MoleculeChains Sequence LengthOrganismDetailsImage
Homer protein homolog 3117Homo sapiensMutation(s): 0 
Gene Names: HOMER3
UniProt & NIH Common Fund Data Resources
Find proteins for Q9NSC5 (Homo sapiens)
Explore Q9NSC5 
Go to UniProtKB:  Q9NSC5
PHAROS:  Q9NSC5
GTEx:  ENSG00000051128 
Entity Groups  
Sequence Clusters30% Identity50% Identity70% Identity90% Identity95% Identity100% Identity
UniProt GroupQ9NSC5
Sequence Annotations
Expand
  • Reference Sequence
Small Molecules
Ligands 1 Unique
IDChains Name / Formula / InChI Key2D Diagram3D Interactions
SO4
Query on SO4

Download Ideal Coordinates CCD File 
B [auth A]SULFATE ION
O4 S
QAOWNCQODCNURD-UHFFFAOYSA-L
Experimental Data & Validation

Experimental Data

  • Method: X-RAY DIFFRACTION
  • Resolution: 1.85 Å
  • R-Value Free: 0.264 
  • R-Value Work: 0.222 
  • Space Group: P 32 2 1
Unit Cell:
Length ( Å )Angle ( ˚ )
a = 49.47α = 90
b = 49.47β = 90
c = 80.71γ = 120
Software Package:
Software NamePurpose
DENZOdata reduction
SCALEPACKdata scaling
MOLREPphasing
CNSrefinement
PDB_EXTRACTdata extraction
ADSCdata collection

Structure Validation

View Full Validation Report


Entry History 

Deposition Data

Revision History  (Full details and data files)

  • Version 1.0: 2007-11-20
    Type: Initial release
  • Version 1.1: 2011-07-13
    Changes: Version format compliance
  • Version 1.2: 2017-10-18
    Changes: Refinement description
  • Version 1.3: 2023-08-30
    Changes: Data collection, Database references, Derived calculations, Refinement description