1W72

Crystal structure of HLA-A1:MAGE-A1 in complex with Fab-Hyb3


Experimental Data Snapshot

  • Method: X-RAY DIFFRACTION
  • Resolution: 2.15 Å
  • R-Value Free: 0.248 
  • R-Value Work: 0.182 
  • R-Value Observed: 0.186 

wwPDB Validation   3D Report Full Report


This is version 1.2 of the entry. See complete history


Literature

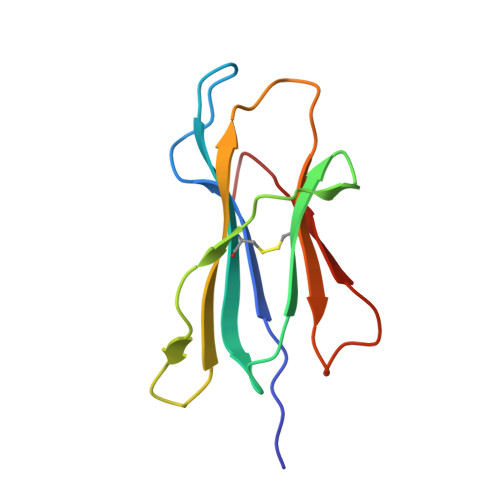
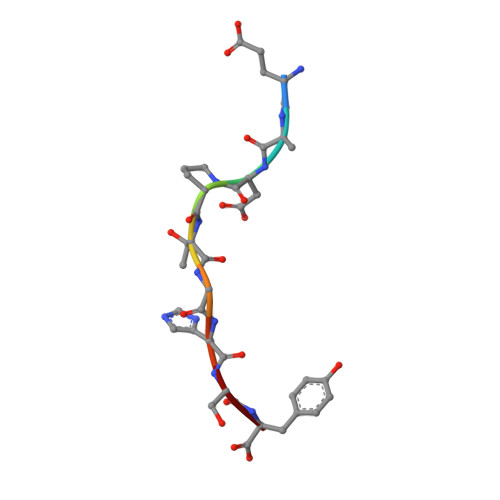
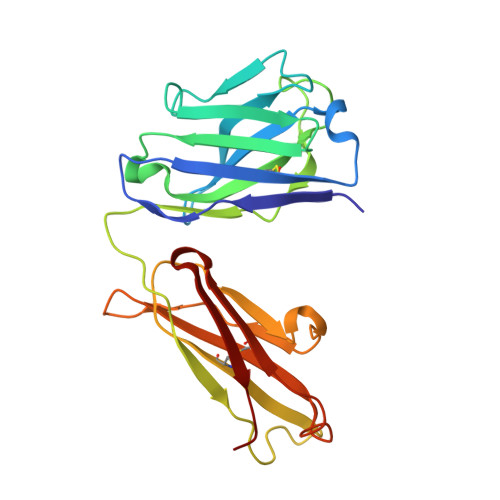
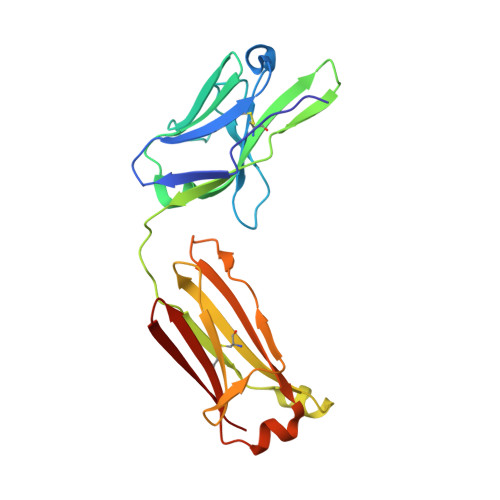
A Major Histocompatibility Complex.Peptide- Restricted Antibody and T Cell Receptor Molecules Recognize Their Target by Distinct Binding Modes: Crystal Structure of Human Leukocyte Antigen (Hla)-A1.Mage-A1 in Complex with Fab-Hyb3

Hulsmeyer, M.Chames, P.Hillig, R.C.Stanfield, R.L.Held, G.Coulie, P.G.Alings, C.Wille, G.Saenger, W.Uchanska-Ziegler, B.Hoogenboom, H.R.Ziegler, A.

(2005) J Biol Chem 280: 2972

  • DOI: https://doi.org/10.1074/jbc.M411323200
  • Primary Citation of Related Structures:  
    1W72

  • PubMed Abstract: 

    Antibodies with T cell receptor-like specificity possess a considerable diagnostic and therapeutic potential, but the structural basis of the interaction between an antibody and an histocompatibility antigen has so far not been determined. We present here the crystal structure (at 2.15 A resolution) of the recombinant, affinity-matured human antibody fragment Fab-Hyb3 bound to the tumor-associated human leukocyte antigen (HLA)/peptide complex HLA-A1.MAGE-A1. Fab-Hyb3 employs a diagonal docking mode resembling that of T cell receptors. However, other than these natural ligands, the antibody uses only four of its six complementarity-determining regions for direct interactions with the target. It recognizes the C-terminal half of the MAGE-A1 peptide, the HLA-A1 alpha1-helix, and N-terminal residues of the alpha2-helix, accompanied by a large tilting angle between the two types of molecules within the complex. Interestingly, only a single hydrogen bond between a peptide side chain and Fab-Hyb3 contributes to the interaction, but large buried surface areas with pronounced shape complementarity assure high affinity and specificity for MAGE-A1. The HLA-A1.MAGE-A1.antibody structure is discussed in comparison with those of natural ligands recognizing HLA.peptide complexes.


  • Organizational Affiliation

    Institut für Chemie/Kristallographie, Freie Universität Berlin, 14195 Berlin, Germany, Cellectis, 93235 Romainville, France.


Macromolecules
Find similar proteins by:  (by identity cutoff)  |  3D Structure
Entity ID: 1
MoleculeChains Sequence LengthOrganismDetailsImage
HLA CLASS I HISTOCOMPATIBILITY ANTIGEN
A, D
274Homo sapiensMutation(s): 0 
UniProt & NIH Common Fund Data Resources
Find proteins for P04439 (Homo sapiens)
Explore P04439 
Go to UniProtKB:  P04439
PHAROS:  P04439
GTEx:  ENSG00000206503 
Entity Groups  
Sequence Clusters30% Identity50% Identity70% Identity90% Identity95% Identity100% Identity
UniProt GroupP04439
Sequence Annotations
Expand
  • Reference Sequence
Find similar proteins by:  (by identity cutoff)  |  3D Structure
Entity ID: 2
MoleculeChains Sequence LengthOrganismDetailsImage
BETA-2-MICROGLOBULIN
B, E
100Homo sapiensMutation(s): 0 
UniProt & NIH Common Fund Data Resources
Find proteins for P61769 (Homo sapiens)
Explore P61769 
Go to UniProtKB:  P61769
PHAROS:  P61769
GTEx:  ENSG00000166710 
Entity Groups  
Sequence Clusters30% Identity50% Identity70% Identity90% Identity95% Identity100% Identity
UniProt GroupP61769
Sequence Annotations
Expand
  • Reference Sequence

Find similar proteins by:  Sequence   |   3D Structure  

Entity ID: 3
MoleculeChains Sequence LengthOrganismDetailsImage
MELANOMA-ASSOCIATED ANTIGEN 1
C, F
9Homo sapiensMutation(s): 0 
UniProt & NIH Common Fund Data Resources
Find proteins for P43355 (Homo sapiens)
Explore P43355 
Go to UniProtKB:  P43355
PHAROS:  P43355
GTEx:  ENSG00000198681 
Entity Groups  
UniProt GroupP43355
Sequence Annotations
Expand
  • Reference Sequence
Find similar proteins by:  (by identity cutoff)  |  3D Structure
Entity ID: 4
MoleculeChains Sequence LengthOrganismDetailsImage
HYB3 HEAVY CHAING [auth H],
H [auth I]
223Homo sapiensMutation(s): 0 
Entity Groups  
Sequence Clusters30% Identity50% Identity70% Identity90% Identity95% Identity100% Identity
Sequence Annotations
Expand
  • Reference Sequence
Find similar proteins by:  (by identity cutoff)  |  3D Structure
Entity ID: 5
MoleculeChains Sequence LengthOrganismDetailsImage
HYB3 LIGHT CHAINI [auth L],
J [auth M]
210Homo sapiensMutation(s): 0 
Entity Groups  
Sequence Clusters30% Identity50% Identity70% Identity90% Identity95% Identity100% Identity
Sequence Annotations
Expand
  • Reference Sequence
Experimental Data & Validation

Experimental Data

  • Method: X-RAY DIFFRACTION
  • Resolution: 2.15 Å
  • R-Value Free: 0.248 
  • R-Value Work: 0.182 
  • R-Value Observed: 0.186 
  • Space Group: P 1 21 1
Unit Cell:
Length ( Å )Angle ( ˚ )
a = 125.359α = 90
b = 50.05β = 109.85
c = 136.705γ = 90
Software Package:
Software NamePurpose
REFMACrefinement
DENZOdata reduction
SCALEPACKdata scaling
AMoREphasing

Structure Validation

View Full Validation Report


Entry History 

Revision History  (Full details and data files)

  • Version 1.0: 2004-11-09
    Type: Initial release
  • Version 1.1: 2011-07-13
    Changes: Advisory, Refinement description, Version format compliance
  • Version 1.2: 2023-12-13
    Changes: Data collection, Database references, Other, Refinement description