1JWM

Crystal Structure of the Complex of the MHC Class II Molecule HLA-DR1(HA peptide 306-318) with the Superantigen SEC3


Experimental Data Snapshot

  • Method: X-RAY DIFFRACTION
  • Resolution: 2.70 Å
  • R-Value Free: 0.228 
  • R-Value Work: 0.192 
  • R-Value Observed: 0.192 

wwPDB Validation   3D Report Full Report


This is version 1.2 of the entry. See complete history


Literature

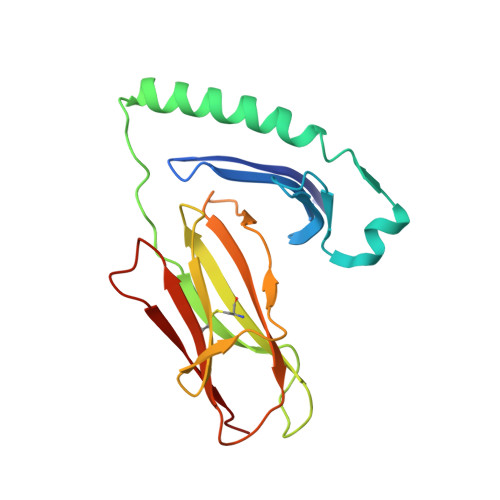
Structural, energetic, and functional analysis of a protein-protein interface at distinct stages of affinity maturation

Sundberg, E.J.Andersen, P.S.Schlievert, P.M.Karjalainen, K.Mariuzza, R.A.

(2003) Structure 11: 1151-1161

  • DOI: https://doi.org/10.1016/s0969-2126(03)00187-4
  • Primary Citation of Related Structures:  
    1JWM, 1JWS, 1JWU

  • PubMed Abstract: 

    Due to a paucity of studies that synthesize structural, energetic, and functional analyses of a series of protein complexes representing distinct stages in an affinity maturation pathway, the biophysical basis for the molecular evolution of protein-protein interactions is poorly understood. Here, we combine crystal structures and binding-free energies of a series of variant superantigen (SAG)-major histocompatibility complex (MHC) class II complexes exhibiting increasingly higher affinity to reveal that this affinity maturation pathway is controlled largely by two biophysical factors: shape complementarity and buried hydrophobic surface. These factors, however, do not contribute equivalently to the affinity maturation of the interface, as the former dominates the early steps of the maturation process while the latter is responsible for improved binding in later steps. Functional assays reveal how affinity maturation of the SAG-MHC interface corresponds to T cell activation by SAGs.


  • Organizational Affiliation

    Center for Advanced Research in Biotechnology, W.M. Keck Laboratory for Structural Biology, University of Maryland Biotechnology Institute, 9600 Gudelsky Drive, Rockville, MD 20850, USA. sundberg@umbi.umd.edu


Macromolecules
Find similar proteins by:  (by identity cutoff)  |  3D Structure
Entity ID: 1
MoleculeChains Sequence LengthOrganismDetailsImage
HLA class II histocompatibility antigen, DR alpha chain182Homo sapiensMutation(s): 0 
UniProt & NIH Common Fund Data Resources
Find proteins for P01903 (Homo sapiens)
Explore P01903 
Go to UniProtKB:  P01903
PHAROS:  P01903
GTEx:  ENSG00000204287 
Entity Groups  
Sequence Clusters30% Identity50% Identity70% Identity90% Identity95% Identity100% Identity
UniProt GroupP01903
Sequence Annotations
Expand
  • Reference Sequence
Find similar proteins by:  (by identity cutoff)  |  3D Structure
Entity ID: 2
MoleculeChains Sequence LengthOrganismDetailsImage
HLA class II histocompatibility antigen, DR-1 beta chain190Homo sapiensMutation(s): 0 
UniProt & NIH Common Fund Data Resources
Find proteins for P01911 (Homo sapiens)
Explore P01911 
Go to UniProtKB:  P01911
PHAROS:  P01911
GTEx:  ENSG00000196126 
Entity Groups  
Sequence Clusters30% Identity50% Identity70% Identity90% Identity95% Identity100% Identity
UniProt GroupP01911
Sequence Annotations
Expand
  • Reference Sequence

Find similar proteins by:  Sequence   |   3D Structure  

Entity ID: 3
MoleculeChains Sequence LengthOrganismDetailsImage
HA peptide13N/AMutation(s): 0 
Entity Groups  
Sequence Clusters30% Identity50% Identity70% Identity90% Identity95% Identity100% Identity
Sequence Annotations
Expand
  • Reference Sequence
Find similar proteins by:  (by identity cutoff)  |  3D Structure
Entity ID: 4
MoleculeChains Sequence LengthOrganismDetailsImage
Enterotoxin type C-3239Staphylococcus aureusMutation(s): 0 
UniProt
Find proteins for P0A0L5 (Staphylococcus aureus)
Explore P0A0L5 
Go to UniProtKB:  P0A0L5
Entity Groups  
Sequence Clusters30% Identity50% Identity70% Identity90% Identity95% Identity100% Identity
UniProt GroupP0A0L5
Sequence Annotations
Expand
  • Reference Sequence
Experimental Data & Validation

Experimental Data

  • Method: X-RAY DIFFRACTION
  • Resolution: 2.70 Å
  • R-Value Free: 0.228 
  • R-Value Work: 0.192 
  • R-Value Observed: 0.192 
  • Space Group: H 3
Unit Cell:
Length ( Å )Angle ( ˚ )
a = 171.695α = 90
b = 171.695β = 90
c = 120.796γ = 120
Software Package:
Software NamePurpose
DENZOdata reduction
SCALEPACKdata scaling
AMoREphasing
CNSrefinement

Structure Validation

View Full Validation Report


Entry History 

Deposition Data

Revision History  (Full details and data files)

  • Version 1.0: 2003-07-08
    Type: Initial release
  • Version 1.1: 2008-04-27
    Changes: Version format compliance
  • Version 1.2: 2011-07-13
    Changes: Version format compliance