3HEC

P38 in complex with Imatinib


Experimental Data Snapshot

  • Method: X-RAY DIFFRACTION
  • Resolution: 2.50 Å
  • R-Value Free: 0.300 
  • R-Value Work: 0.218 
  • R-Value Observed: 0.222 

wwPDB Validation   3D Report Full Report


Ligand Structure Quality Assessment 


This is version 1.3 of the entry. See complete history


Literature

Analysis of imatinib and sorafenib binding to p38alpha compared with c-Abl and b-Raf provides structural insights for understanding the selectivity of inhibitors targeting the DFG-out form of protein kinases.

Namboodiri, H.V.Bukhtiyarova, M.Ramcharan, J.Karpusas, M.Lee, Y.Springman, E.B.

(2010) Biochemistry 49: 3611-3618

  • DOI: https://doi.org/10.1021/bi100070r
  • Primary Citation of Related Structures:  
    3HEC, 3HEG

  • PubMed Abstract: 

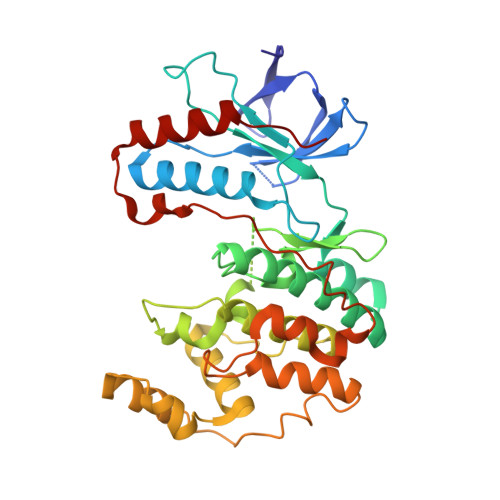
    Protein kinases c-Abl, b-Raf, and p38alpha are recognized as important targets for therapeutic intervention. c-Abl and b-Raf are major targets of marketed oncology drugs Imatinib (Gleevec) and Sorafenib (Nexavar), respectively, and BIRB-796 is a p38alpha inhibitor that reached Phase II clinical trials. A shared feature of these drugs is the fact that they bind to the DFG-out forms of their kinase targets. Although the discovery of this class of kinase inhibitors has increased the level of emphasis on the design of DFG-out inhibitors, the structural determinants for their binding and stabilization of the DFG-out conformation remain unclear. To improve our understanding of these determinants, we determined cocrystal structures of Imatinib and Sorafenib with p38alpha. We also conducted a detailed analysis of Imatinib and Sorafenib binding to p38alpha in comparison with BIRB-796, including binding kinetics, binding interactions, the solvent accessible surface area (SASA) of the ligands, and stabilization of key structural elements of the protein upon ligand binding. Our results yield an improved understanding of the structural requirements for stabilizing the DFG-out form and a rationale for understanding the genesis of ligand selectivity among DFG-out inhibitors of protein kinases.


  • Organizational Affiliation

    Department of Biology, Locus Pharmaceuticals, Inc, Four Valley Square, 512 East Township Line Rd,Blue Bell, Pennsylvania 19422, USA. vnamboodiri@ansarisbio.com


Macromolecules
Find similar proteins by:  (by identity cutoff)  |  3D Structure
Entity ID: 1
MoleculeChains Sequence LengthOrganismDetailsImage
Mitogen-activated protein kinase 14348Homo sapiensMutation(s): 0 
Gene Names: CSBPCSBP1CSBP2CSPB1MAPK14MXI2
EC: 2.7.11.24
UniProt & NIH Common Fund Data Resources
Find proteins for Q16539 (Homo sapiens)
Explore Q16539 
Go to UniProtKB:  Q16539
PHAROS:  Q16539
GTEx:  ENSG00000112062 
Entity Groups  
Sequence Clusters30% Identity50% Identity70% Identity90% Identity95% Identity100% Identity
UniProt GroupQ16539
Sequence Annotations
Expand
  • Reference Sequence
Small Molecules
Ligands 2 Unique
IDChains Name / Formula / InChI Key2D Diagram3D Interactions
STI
Query on STI

Download Ideal Coordinates CCD File 
B [auth A]4-(4-METHYL-PIPERAZIN-1-YLMETHYL)-N-[4-METHYL-3-(4-PYRIDIN-3-YL-PYRIMIDIN-2-YLAMINO)-PHENYL]-BENZAMIDE
C29 H31 N7 O
KTUFNOKKBVMGRW-UHFFFAOYSA-N
BOG
Query on BOG

Download Ideal Coordinates CCD File 
C [auth A]octyl beta-D-glucopyranoside
C14 H28 O6
HEGSGKPQLMEBJL-RKQHYHRCSA-N
Binding Affinity Annotations 
IDSourceBinding Affinity
STI PDBBind:  3HEC Kd: 3.40e+4 (nM) from 1 assay(s)
Binding MOAD:  3HEC Kd: 3.40e+4 (nM) from 1 assay(s)
BindingDB:  3HEC Kd: min: 3162, max: 1.00e+4 (nM) from 2 assay(s)
IC50: min: 1.37e+4, max: 1.00e+5 (nM) from 2 assay(s)
Experimental Data & Validation

Experimental Data

  • Method: X-RAY DIFFRACTION
  • Resolution: 2.50 Å
  • R-Value Free: 0.300 
  • R-Value Work: 0.218 
  • R-Value Observed: 0.222 
  • Space Group: P 21 21 21
Unit Cell:
Length ( Å )Angle ( ˚ )
a = 65.029α = 90
b = 74.031β = 90
c = 74.497γ = 90
Software Package:
Software NamePurpose
ADSCdata collection
MOLREPphasing
REFMACrefinement
HKL-2000data reduction
HKL-2000data scaling

Structure Validation

View Full Validation Report


Ligand Structure Quality Assessment 


Entry History 

Deposition Data

Revision History  (Full details and data files)

  • Version 1.0: 2009-11-10
    Type: Initial release
  • Version 1.1: 2011-07-13
    Changes: Version format compliance
  • Version 1.2: 2020-07-29
    Type: Remediation
    Reason: Carbohydrate remediation
    Changes: Data collection, Derived calculations, Structure summary
  • Version 1.3: 2023-09-06
    Changes: Data collection, Database references, Refinement description, Structure summary