


Inhibition of FosB by PPF
Travis, S., Thompson, M.K.To be published.
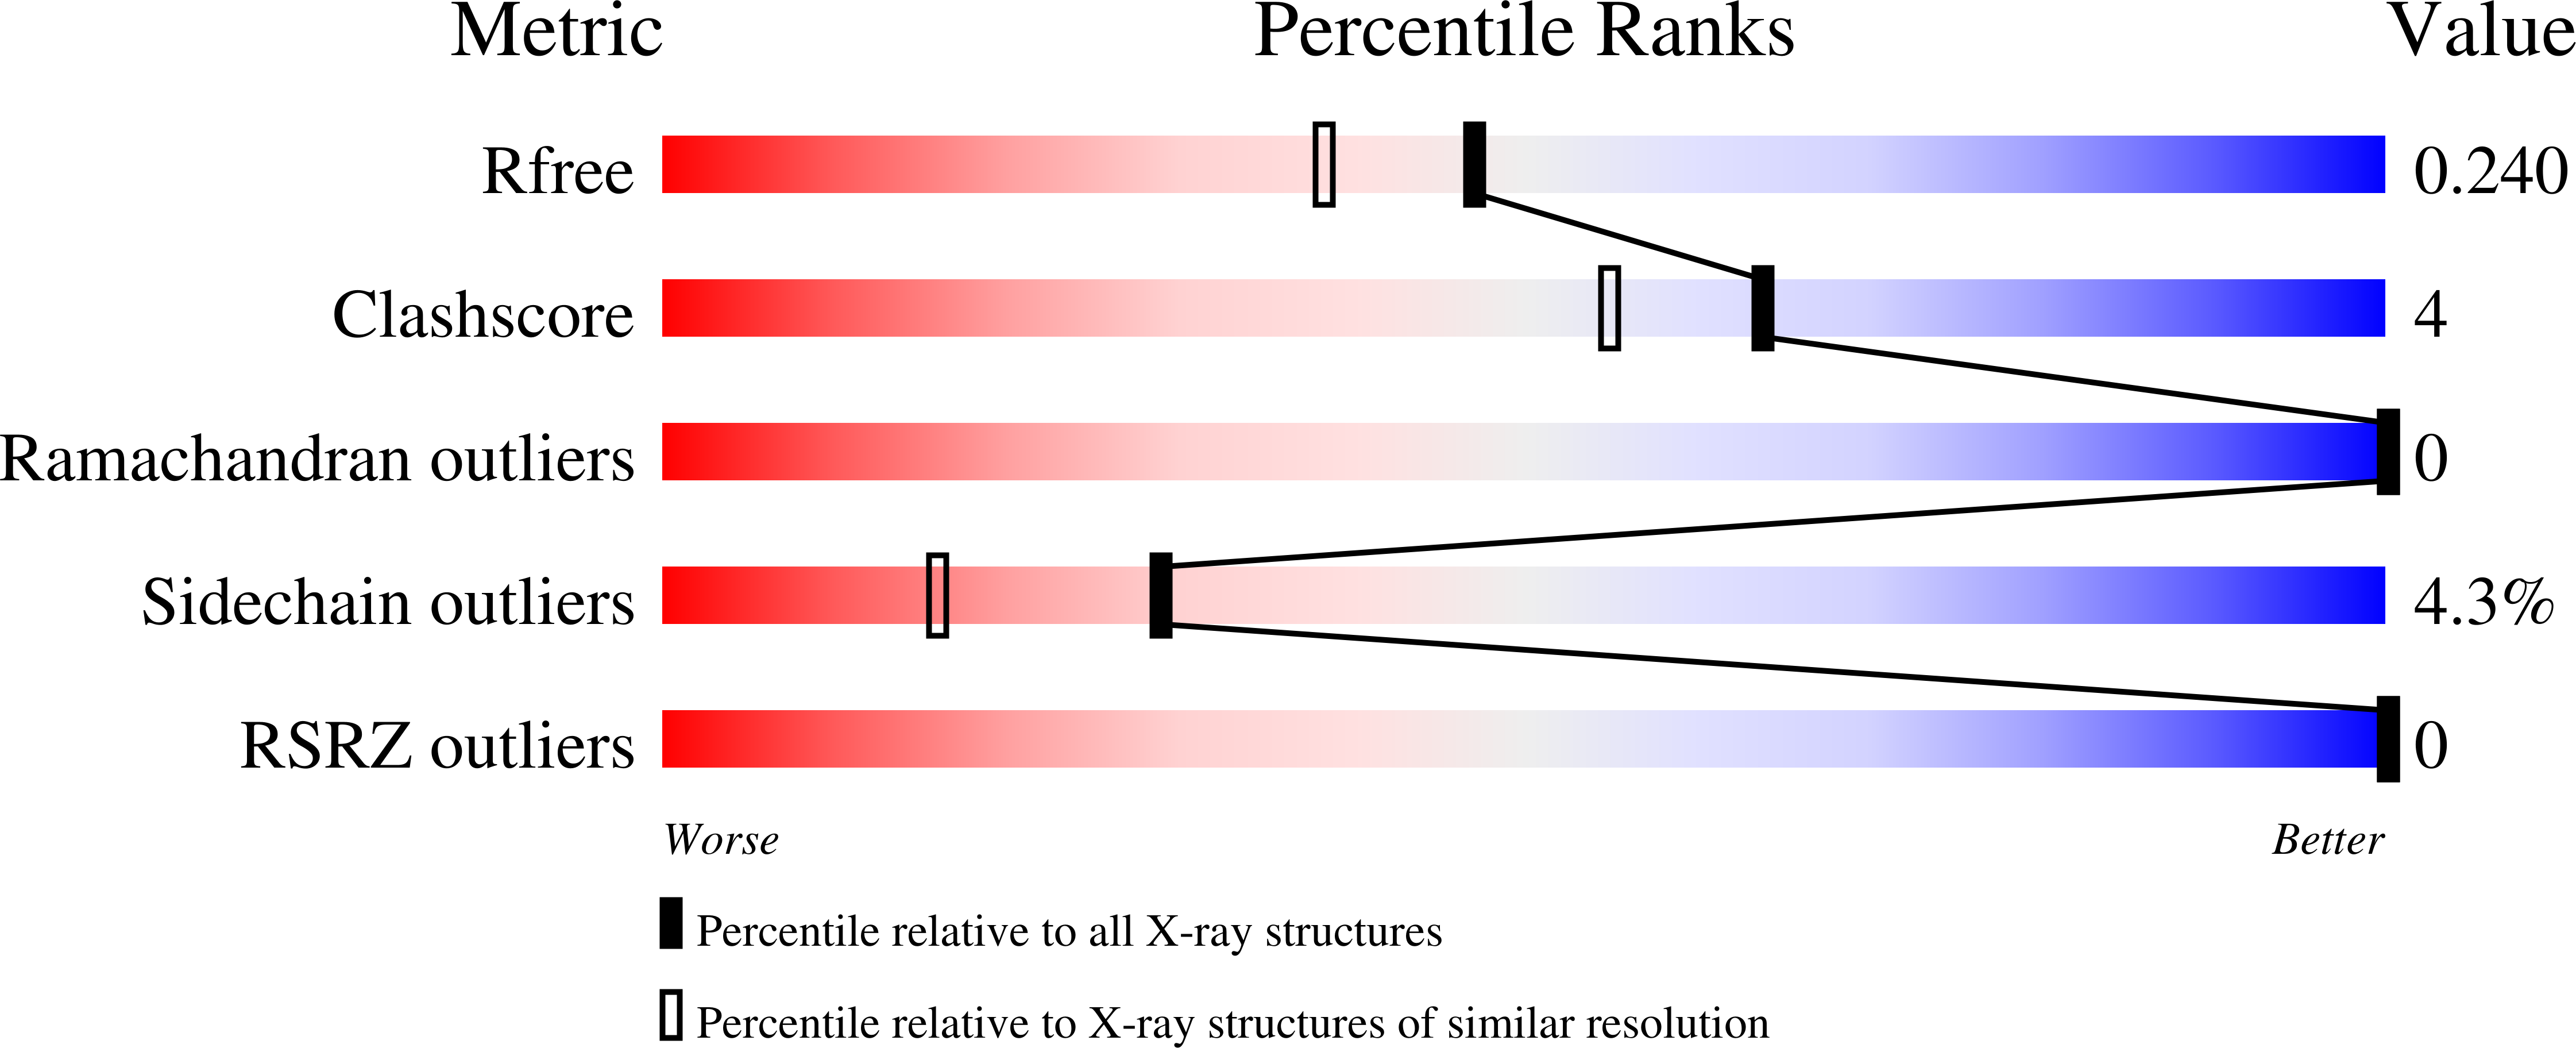
Experimental Data Snapshot
Entity ID: 1 | |||||
|---|---|---|---|---|---|
| Molecule | Chains | Sequence Length | Organism | Details | Image |
| Metallothiol transferase FosB | 138 | Bacillus cereus ATCC 10987 | Mutation(s): 0 Gene Names: fosB, BCE_2111 EC: 2.5.1 | 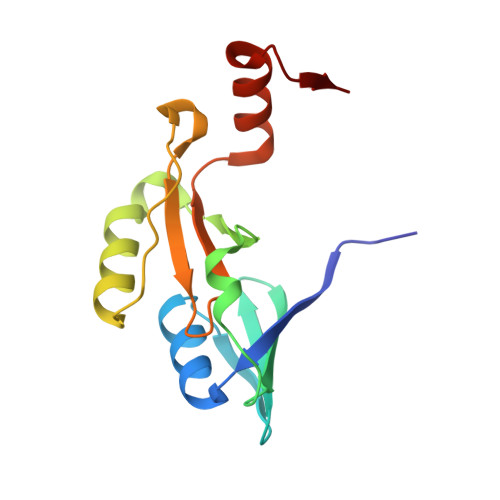 | |
UniProt | |||||
Find proteins for Q739M9 (Bacillus cereus (strain ATCC 10987 / NRS 248)) Explore Q739M9 Go to UniProtKB: Q739M9 | |||||
Entity Groups | |||||
| Sequence Clusters | 30% Identity50% Identity70% Identity90% Identity95% Identity100% Identity | ||||
| UniProt Group | Q739M9 | ||||
Sequence AnnotationsExpand | |||||
| |||||
| Ligands 2 Unique | |||||
|---|---|---|---|---|---|
| ID | Chains | Name / Formula / InChI Key | 2D Diagram | 3D Interactions | |
| PPF (Subject of Investigation/LOI) Query on PPF | C [auth A], E [auth B] | PHOSPHONOFORMIC ACID C H3 O5 P ZJAOAACCNHFJAH-UHFFFAOYSA-N |  | ||
| ZN Query on ZN | D [auth A], F [auth B] | ZINC ION Zn PTFCDOFLOPIGGS-UHFFFAOYSA-N |  | ||
| Length ( Å ) | Angle ( ˚ ) |
|---|---|
| a = 56.474 | α = 90 |
| b = 64.353 | β = 90 |
| c = 83.942 | γ = 90 |
| Software Name | Purpose |
|---|---|
| XDS | data reduction |
| Aimless | data scaling |
| REFMAC | refinement |
| PDB_EXTRACT | data extraction |
| PHASER | phasing |
| Funding Organization | Location | Grant Number |
|---|---|---|
| Cystic Fibrosis Foundation | United States | THOMPS20I0 |
RCSB PDB (citation) is hosted by
RCSB PDB is a member of the

