6Y1G

Photoconverted HcRed in its optoacoustic state


Experimental Data Snapshot

  • Method: X-RAY DIFFRACTION
  • Resolution: 2.30 Å
  • R-Value Free: 0.247 
  • R-Value Work: 0.168 
  • R-Value Observed: 0.172 

wwPDB Validation   3D Report Full Report


Ligand Structure Quality Assessment 


This is version 2.1 of the entry. See complete history


Literature

Challenging a Preconception: Optoacoustic Spectrum Differs from the Optical Absorption Spectrum of Proteins and Dyes for Molecular Imaging.

Fuenzalida Werner, J.P.Huang, Y.Mishra, K.Janowski, R.Vetschera, P.Heichler, C.Chmyrov, A.Neufert, C.Niessing, D.Ntziachristos, V.Stiel, A.C.

(2020) Anal Chem 92: 10717-10724

  • DOI: https://doi.org/10.1021/acs.analchem.0c01902
  • Primary Citation of Related Structures:  
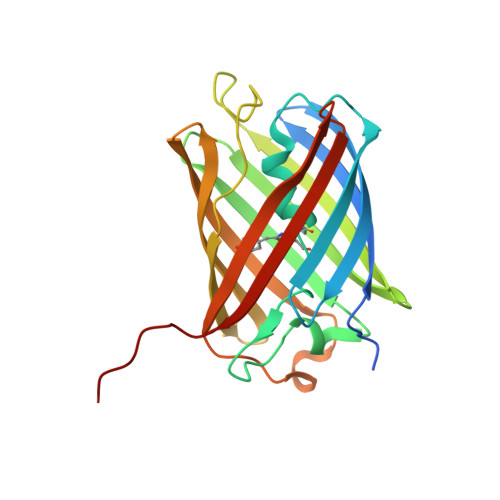
    6Y1G

  • PubMed Abstract: 

    Optoacoustic (photoacoustic) imaging has seen marked advances in detection and data analysis, but there is less progress in understanding the photophysics of common optoacoustic contrast agents. This gap blocks the development of novel agents and the accurate analysis and interpretation of multispectral optoacoustic images. To close it, we developed a multimodal laser spectrometer (MLS) to enable the simultaneous measurement of optoacoustic, absorbance, and fluorescence spectra. Herein, we employ MLS to analyze contrast agents (methylene blue, rhodamine 800, Alexa Fluor 750, IRDye 800CW, and indocyanine green) and proteins (sfGFP, mCherry, mKate, HcRed, iRFP720, and smURFP). We found that the optical absorption spectrum does not correlate with the optoacoustic spectrum for the majority of the analytes. We determined that for dyes, the transition underlying an aggregation state has more optoacoustic signal generation efficiency than the monomer transition. For proteins we found a favored optoacoustic relaxation that stems from the neutral or zwitterionic chromophores and unreported photoswitching behavior of tdTomato and HcRed. We then crystalized HcRed in its photoswitch optoacoustic state, confirming structurally the change in isomerization with respect to HcReds' fluorescence state. Finally, on the example of the widely used label tdTomato and the dye indocyanine green, we show the importance of correct photophysical (e.g., spectral and kinetic) information as a prerequisite for spectral-unmixing for in vivo imaging.


  • Organizational Affiliation

    Institute of Biological and Medical Imaging (IBMI), Helmholtz Zentrum München, D-85764 Neuherberg, Germany.


Macromolecules
Find similar proteins by:  (by identity cutoff)  |  3D Structure
Entity ID: 1
MoleculeChains Sequence LengthOrganismDetailsImage
GFP-like non-fluorescent chromoprotein
A, B, C, D
236Radianthus crispaMutation(s): 1 
UniProt
Find proteins for Q95W85 (Heteractis crispa)
Explore Q95W85 
Go to UniProtKB:  Q95W85
Entity Groups  
Sequence Clusters30% Identity50% Identity70% Identity90% Identity95% Identity100% Identity
UniProt GroupQ95W85
Sequence Annotations
Expand
  • Reference Sequence
Small Molecules
Ligands 1 Unique
IDChains Name / Formula / InChI Key2D Diagram3D Interactions
EDO (Subject of Investigation/LOI)
Query on EDO

Download Ideal Coordinates CCD File 
E [auth A]
F [auth A]
G [auth A]
H [auth A]
I [auth A]
E [auth A],
F [auth A],
G [auth A],
H [auth A],
I [auth A],
J [auth B],
K [auth B],
L [auth B],
M [auth B],
N [auth B],
O [auth C],
P [auth C],
Q [auth C],
R [auth C],
S [auth D],
T [auth D],
U [auth D],
V [auth D],
W [auth D]
1,2-ETHANEDIOL
C2 H6 O2
LYCAIKOWRPUZTN-UHFFFAOYSA-N
Modified Residues  1 Unique
IDChains TypeFormula2D DiagramParent
CRU
Query on CRU
A, B, C, D
L-PEPTIDE LINKINGC16 H15 N3 O6GLU, TYR, GLY
Experimental Data & Validation

Experimental Data

  • Method: X-RAY DIFFRACTION
  • Resolution: 2.30 Å
  • R-Value Free: 0.247 
  • R-Value Work: 0.168 
  • R-Value Observed: 0.172 
  • Space Group: P 21 21 21
Unit Cell:
Length ( Å )Angle ( ˚ )
a = 50.71α = 90
b = 75.2β = 90
c = 254.21γ = 90
Software Package:
Software NamePurpose
REFMACrefinement
PDB_EXTRACTdata extraction
XDSdata reduction
SCALAdata scaling
MOLREPphasing

Structure Validation

View Full Validation Report


Ligand Structure Quality Assessment 


Entry History & Funding Information

Deposition Data


Funding OrganizationLocationGrant Number
German Research Foundation (DFG)GermanyDFG SFB 1054 (TP B09)

Revision History  (Full details and data files)

  • Version 1.0: 2020-07-29
    Type: Initial release
  • Version 1.1: 2020-08-05
    Changes: Structure summary
  • Version 1.2: 2020-08-26
    Changes: Database references
  • Version 2.0: 2023-11-15
    Changes: Atomic model, Data collection, Database references, Derived calculations
  • Version 2.1: 2024-01-24
    Changes: Refinement description