


Design, Synthesis and Evaluation of Novel Dual- Binding Inhibitors of the Tankyrases and Wnt Signalling.
Nathubhai, A., Haikarainen, T., Hayward, P.C., Munoz-Descalzo, S., Tosh, D., Lloyd, M.D., Lehtio, L., Threadgill, M.D.To be published.
Experimental Data Snapshot
Starting Model: experimental
View more details
Entity ID: 1 | |||||
|---|---|---|---|---|---|
| Molecule | Chains | Sequence Length | Organism | Details | Image |
| TANKYRASE-2 | 191 | Homo sapiens | Mutation(s): 0 | 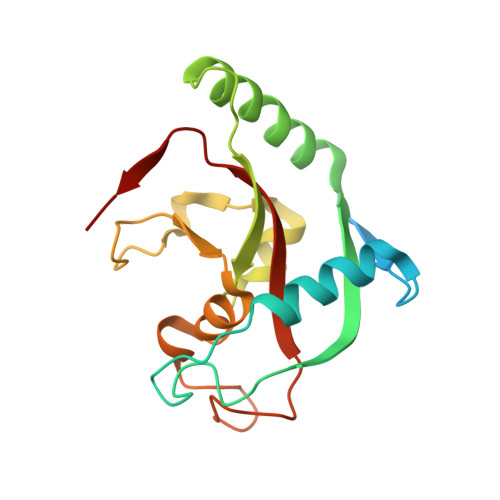 | |
UniProt & NIH Common Fund Data Resources | |||||
Find proteins for Q9H2K2 (Homo sapiens) Explore Q9H2K2 Go to UniProtKB: Q9H2K2 | |||||
PHAROS: Q9H2K2 GTEx: ENSG00000107854 | |||||
Entity Groups | |||||
| Sequence Clusters | 30% Identity50% Identity70% Identity90% Identity95% Identity100% Identity | ||||
| UniProt Group | Q9H2K2 | ||||
Sequence AnnotationsExpand | |||||
| |||||
Entity ID: 2 | |||||
|---|---|---|---|---|---|
| Molecule | Chains | Sequence Length | Organism | Details | Image |
| TANKYRASE-2 | 48 | Homo sapiens | Mutation(s): 0 | 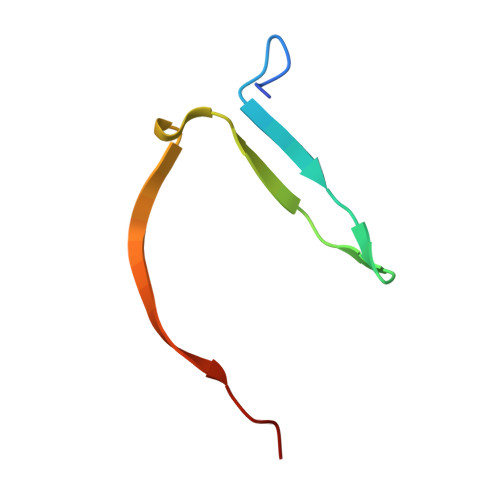 | |
UniProt & NIH Common Fund Data Resources | |||||
Find proteins for Q9H2K2 (Homo sapiens) Explore Q9H2K2 Go to UniProtKB: Q9H2K2 | |||||
PHAROS: Q9H2K2 GTEx: ENSG00000107854 | |||||
Entity Groups | |||||
| Sequence Clusters | 30% Identity50% Identity70% Identity90% Identity95% Identity100% Identity | ||||
| UniProt Group | Q9H2K2 | ||||
Sequence AnnotationsExpand | |||||
| |||||
| Ligands 2 Unique | |||||
|---|---|---|---|---|---|
| ID | Chains | Name / Formula / InChI Key | 2D Diagram | 3D Interactions | |
| 5ZI Query on 5ZI | F [auth A], H [auth B] | 4-[3-(4-oxo-3,4-dihydroquinazolin-2- yl)propanamido]-N-(quinolin-8-yl)benzamide C27 H21 N5 O3 HILQRGHXDPSDBM-UHFFFAOYSA-N |  | ||
| ZN Query on ZN | E [auth A], G [auth B] | ZINC ION Zn PTFCDOFLOPIGGS-UHFFFAOYSA-N |  | ||
| Length ( Å ) | Angle ( ˚ ) |
|---|---|
| a = 41.6 | α = 90 |
| b = 76.08 | β = 90 |
| c = 149.05 | γ = 90 |
| Software Name | Purpose |
|---|---|
| PHENIX | refinement |
| XDS | data reduction |
| XSCALE | data scaling |
| PHASER | phasing |
RCSB PDB (citation) is hosted by
RCSB PDB is a member of the

