3K1L

Crystal Structure of FANCL


Experimental Data Snapshot

  • Method: X-RAY DIFFRACTION
  • Resolution: 3.20 Å
  • R-Value Free: 0.247 
  • R-Value Work: 0.205 
  • R-Value Observed: 0.207 

wwPDB Validation   3D Report Full Report


This is version 2.1 of the entry. See complete history


Literature

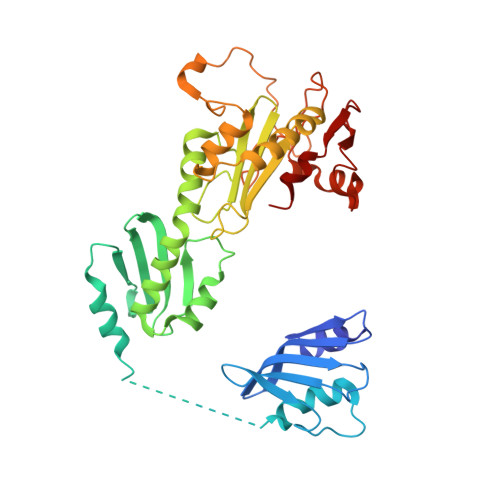
The structure of the catalytic subunit FANCL of the Fanconi anemia core complex

Cole, A.R.Lewis, L.P.C.Walden, H.

(2010) Nat Struct Mol Biol 17: 294-298

  • DOI: https://doi.org/10.1038/nsmb.1759
  • Primary Citation of Related Structures:  
    3K1L

  • PubMed Abstract: 

    The Fanconi anemia (FA) pathway is activated in response to DNA damage, leading to monoubiquitination of the substrates FANCI and FANCD2 by the FA core complex. Here we report the crystal structure of FANCL, the catalytic subunit of the FA core complex, at 3.2 A. The structure reveals an architecture fundamentally different from previous sequence-based predictions. The molecule is composed of an N-terminal E2-like fold, which we term the ELF domain, a novel double-RWD (DRWD) domain, and a C-terminal really interesting new gene (RING) domain predicted to facilitate E2 binding. Binding assays show that the DRWD domain, but not the ELF domain, is responsible for substrate binding.


  • Organizational Affiliation

    Protein Structure and Function Laboratory, Lincoln's Inn Fields Laboratories of the London Research Institute, Cancer Research UK, London Research Institute, London, UK.


Macromolecules
Find similar proteins by:  (by identity cutoff)  |  3D Structure
Entity ID: 1
MoleculeChains Sequence LengthOrganismDetailsImage
FanclA [auth B],
B [auth A]
381Drosophila melanogasterMutation(s): 0 
Gene Names: CG12812
EC: 6.3.2.19
UniProt
Find proteins for Q8T913 (Drosophila melanogaster)
Explore Q8T913 
Go to UniProtKB:  Q8T913
Entity Groups  
Sequence Clusters30% Identity50% Identity70% Identity90% Identity95% Identity100% Identity
UniProt GroupQ8T913
Sequence Annotations
Expand
  • Reference Sequence
Oligosaccharides

Help

Entity ID: 2
MoleculeChains Length2D Diagram Glycosylation3D Interactions
alpha-D-glucopyranose-(1-4)-alpha-D-glucopyranose
C, D
2N/A
Glycosylation Resources
GlyTouCan:  G07411ON
GlyCosmos:  G07411ON
Small Molecules
Ligands 3 Unique
IDChains Name / Formula / InChI Key2D Diagram3D Interactions
AU
Query on AU

Download Ideal Coordinates CCD File 
G [auth B]
H [auth B]
I [auth B]
J [auth B]
K [auth B]
G [auth B],
H [auth B],
I [auth B],
J [auth B],
K [auth B],
L [auth B],
M [auth B],
N [auth B],
R [auth A],
S [auth A],
T [auth A],
U [auth A],
V [auth A]
GOLD ION
Au
ZBKIUFWVEIBQRT-UHFFFAOYSA-N
CIT
Query on CIT

Download Ideal Coordinates CCD File 
O [auth B],
W [auth A],
X [auth A]
CITRIC ACID
C6 H8 O7
KRKNYBCHXYNGOX-UHFFFAOYSA-N
ZN
Query on ZN

Download Ideal Coordinates CCD File 
E [auth B],
F [auth B],
P [auth A],
Q [auth A]
ZINC ION
Zn
PTFCDOFLOPIGGS-UHFFFAOYSA-N
Biologically Interesting Molecules (External Reference) 1 Unique
Experimental Data & Validation

Experimental Data

  • Method: X-RAY DIFFRACTION
  • Resolution: 3.20 Å
  • R-Value Free: 0.247 
  • R-Value Work: 0.205 
  • R-Value Observed: 0.207 
  • Space Group: H 3 2
Unit Cell:
Length ( Å )Angle ( ˚ )
a = 188.68α = 90
b = 188.68β = 90
c = 259.36γ = 120
Software Package:
Software NamePurpose
SHARPphasing
PHENIXrefinement
MOSFLMdata reduction
SCALAdata scaling

Structure Validation

View Full Validation Report


Entry History 

Deposition Data

Revision History  (Full details and data files)

  • Version 1.0: 2010-02-16
    Type: Initial release
  • Version 1.1: 2011-07-13
    Changes: Version format compliance
  • Version 1.2: 2014-02-12
    Changes: Database references
  • Version 1.3: 2019-12-04
    Changes: Advisory, Derived calculations
  • Version 2.0: 2020-07-29
    Type: Remediation
    Reason: Carbohydrate remediation
    Changes: Atomic model, Data collection, Derived calculations, Non-polymer description, Structure summary
  • Version 2.1: 2024-03-20
    Changes: Data collection, Database references, Refinement description, Structure summary