3ZYV

Crystal structure of the mouse liver Aldehyde Oxidase 3 (mAOX3)


Experimental Data Snapshot

  • Method: X-RAY DIFFRACTION
  • Resolution: 2.54 Å
  • R-Value Free: 0.285 
  • R-Value Work: 0.256 
  • R-Value Observed: 0.257 

wwPDB Validation   3D Report Full Report


Ligand Structure Quality Assessment 


This is version 1.3 of the entry. See complete history


Literature

The First Mammalian Aldehyde Oxidase Crystal Structure: Insights Into Substrate Specificity.

Coelho, C.Mahro, M.Trincao, J.Carvalho, A.T.P.Ramos, M.J.Terao, M.Garattini, E.Leimkuhler, S.Romao, M.J.

(2012) J Biol Chem 287: 40690

  • DOI: https://doi.org/10.1074/jbc.M112.390419
  • Primary Citation of Related Structures:  
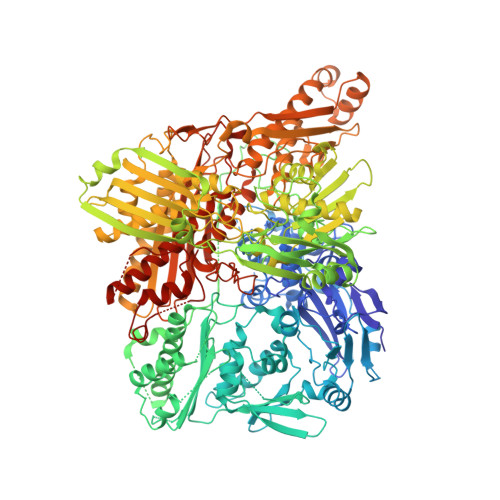
    3ZYV

  • PubMed Abstract: 

    Aldehyde oxidases have pharmacological relevance, and AOX3 is the major drug-metabolizing enzyme in rodents. The crystal structure of mouse AOX3 with kinetics and molecular docking studies provides insights into its enzymatic characteristics. Differences in substrate and inhibitor specificities can be rationalized by comparing the AOX3 and xanthine oxidase structures. The first aldehyde oxidase structure represents a major advance for drug design and mechanistic studies. Aldehyde oxidases (AOXs) are homodimeric proteins belonging to the xanthine oxidase family of molybdenum-containing enzymes. Each 150-kDa monomer contains a FAD redox cofactor, two spectroscopically distinct [2Fe-2S] clusters, and a molybdenum cofactor located within the protein active site. AOXs are characterized by broad range substrate specificity, oxidizing different aldehydes and aromatic N-heterocycles. Despite increasing recognition of its role in the metabolism of drugs and xenobiotics, the physiological function of the protein is still largely unknown. We have crystallized and solved the crystal structure of mouse liver aldehyde oxidase 3 to 2.9 Å. This is the first mammalian AOX whose structure has been solved. The structure provides important insights into the protein active center and further evidence on the catalytic differences characterizing AOX and xanthine oxidoreductase. The mouse liver aldehyde oxidase 3 three-dimensional structure combined with kinetic, mutagenesis data, molecular docking, and molecular dynamics studies make a decisive contribution to understand the molecular basis of its rather broad substrate specificity.


  • Organizational Affiliation

    Requimte, Departamento de Química, Faculdade de Ciências e Tecnologia, Universidade Nova de Lisboa, 2829-516 Caparica, Portugal.


Macromolecules
Find similar proteins by:  (by identity cutoff)  |  3D Structure
Entity ID: 1
MoleculeChains Sequence LengthOrganismDetailsImage
AOX3
A, B, C, D
1,335Mus musculusMutation(s): 0 
EC: 1.2.3.1
UniProt
Find proteins for G3X982 (Mus musculus)
Explore G3X982 
Go to UniProtKB:  G3X982
Entity Groups  
Sequence Clusters30% Identity50% Identity70% Identity90% Identity95% Identity100% Identity
UniProt GroupG3X982
Sequence Annotations
Expand
  • Reference Sequence
Small Molecules
Ligands 5 Unique
IDChains Name / Formula / InChI Key2D Diagram3D Interactions
FAD
Query on FAD

Download Ideal Coordinates CCD File 
BA [auth D],
J [auth A],
P [auth B],
V [auth C]
FLAVIN-ADENINE DINUCLEOTIDE
C27 H33 N9 O15 P2
VWWQXMAJTJZDQX-UYBVJOGSSA-N
MTE
Query on MTE

Download Ideal Coordinates CCD File 
H [auth A],
N [auth B],
T [auth C],
Z [auth D]
PHOSPHONIC ACIDMONO-(2-AMINO-5,6-DIMERCAPTO-4-OXO-3,7,8A,9,10,10A-HEXAHYDRO-4H-8-OXA-1,3,9,10-TETRAAZA-ANTHRACEN-7-YLMETHYL)ESTER
C10 H14 N5 O6 P S2
HPEUEJRPDGMIMY-IFQPEPLCSA-N
FES
Query on FES

Download Ideal Coordinates CCD File 
F [auth A]
G [auth A]
L [auth B]
M [auth B]
R [auth C]
F [auth A],
G [auth A],
L [auth B],
M [auth B],
R [auth C],
S [auth C],
X [auth D],
Y [auth D]
FE2/S2 (INORGANIC) CLUSTER
Fe2 S2
NIXDOXVAJZFRNF-UHFFFAOYSA-N
MOS
Query on MOS

Download Ideal Coordinates CCD File 
AA [auth D],
I [auth A],
O [auth B],
U [auth C]
DIOXOTHIOMOLYBDENUM(VI) ION
H Mo O2 S
BDSRWPHSAKXXRG-UHFFFAOYSA-M
NA
Query on NA

Download Ideal Coordinates CCD File 
E [auth A],
K [auth B],
Q [auth C],
W [auth D]
SODIUM ION
Na
FKNQFGJONOIPTF-UHFFFAOYSA-N
Experimental Data & Validation

Experimental Data

  • Method: X-RAY DIFFRACTION
  • Resolution: 2.54 Å
  • R-Value Free: 0.285 
  • R-Value Work: 0.256 
  • R-Value Observed: 0.257 
  • Space Group: P 1
Unit Cell:
Length ( Å )Angle ( ˚ )
a = 90.88α = 78.16
b = 135.27β = 77.72
c = 147.37γ = 89.9
Software Package:
Software NamePurpose
PHENIXrefinement
MOSFLMdata reduction
SCALAdata scaling
PHASERphasing

Structure Validation

View Full Validation Report


Ligand Structure Quality Assessment 


Entry History 

Deposition Data

Revision History  (Full details and data files)

  • Version 1.0: 2012-09-05
    Type: Initial release
  • Version 1.1: 2013-04-10
    Changes: Database references
  • Version 1.2: 2013-04-24
    Changes: Structure summary
  • Version 1.3: 2023-12-20
    Changes: Data collection, Database references, Derived calculations, Other, Refinement description