2ZCA

Crystal Structure of TTHB189, a CRISPR-associated protein, Cse2 family from Thermus thermophilus HB8


Experimental Data Snapshot

  • Method: X-RAY DIFFRACTION
  • Resolution: 1.80 Å
  • R-Value Free: 0.215 
  • R-Value Work: 0.186 
  • R-Value Observed: 0.186 

wwPDB Validation   3D Report Full Report


This is version 1.1 of the entry. See complete history


Literature

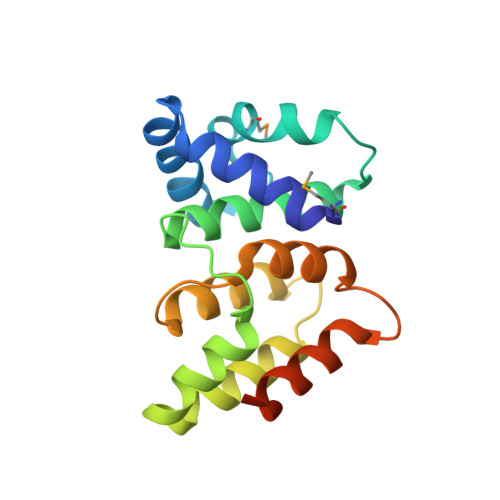
X-ray crystal structure of a CRISPR-associated protein, Cse2, from Thermus thermophilus HB8

Agari, Y.Yokoyama, S.Kuramitsu, S.Shinkai, A.

(2008) Proteins 73: 1063-1067


Macromolecules
Find similar proteins by:  (by identity cutoff)  |  3D Structure
Entity ID: 1
MoleculeChains Sequence LengthOrganismDetailsImage
Putative uncharacterized protein TTHB189
A, B
169Thermus thermophilusMutation(s): 0 
UniProt
Find proteins for Q53VY0 (Thermus thermophilus (strain ATCC 27634 / DSM 579 / HB8))
Explore Q53VY0 
Go to UniProtKB:  Q53VY0
Entity Groups  
Sequence Clusters30% Identity50% Identity70% Identity90% Identity95% Identity100% Identity
UniProt GroupQ53VY0
Sequence Annotations
Expand
  • Reference Sequence
Small Molecules
Modified Residues  1 Unique
IDChains TypeFormula2D DiagramParent
MSE
Query on MSE
A, B
L-PEPTIDE LINKINGC5 H11 N O2 SeMET
Experimental Data & Validation

Experimental Data

  • Method: X-RAY DIFFRACTION
  • Resolution: 1.80 Å
  • R-Value Free: 0.215 
  • R-Value Work: 0.186 
  • R-Value Observed: 0.186 
  • Space Group: P 1 21 1
Unit Cell:
Length ( Å )Angle ( ˚ )
a = 52.081α = 90
b = 71.238β = 115.78
c = 53.753γ = 90
Software Package:
Software NamePurpose
CNSrefinement
BSSdata collection
HKL-2000data reduction
HKL-2000data scaling
SOLVEphasing

Structure Validation

View Full Validation Report


Entry History 

Deposition Data

Revision History  (Full details and data files)

  • Version 1.0: 2008-10-07
    Type: Initial release
  • Version 1.1: 2011-07-13
    Changes: Version format compliance