1CJQ

X-RAY CRYSTALLOGRAPHIC STUDIES OF THE DENATURATION OF THE DENATURATION OF RIBONUCLEASE S.


Experimental Data Snapshot

  • Method: X-RAY DIFFRACTION
  • Resolution: 3.00 Å
  • R-Value Free: 0.253 
  • R-Value Work: 0.175 

wwPDB Validation   3D Report Full Report


This is version 1.4 of the entry. See complete history


Literature

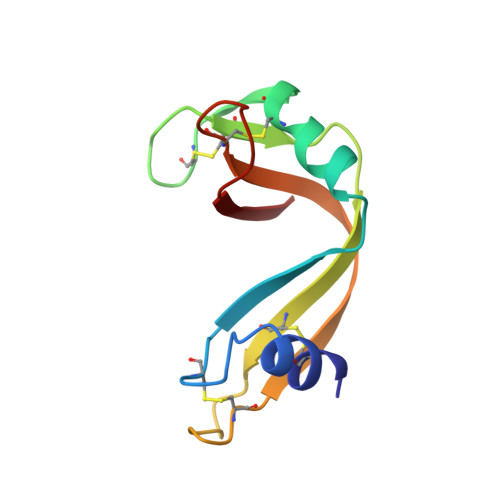
X-ray crystallographic studies of the denaturation of ribonuclease S.

Ratnaparkhi, G.S.Varadarajan, R.

(1999) Proteins 36: 282-294

  • Primary Citation of Related Structures:  
    1CJQ, 1CJR

  • PubMed Abstract: 

    In an attempt to view the onset of urea denaturation in ribonuclease we have collected X-ray diffraction data on ribonuclease S crystals soaked in 0, 1.5, 2, 3, and 5 molar urea. At concentrations above 2 M urea, crystals were stabilized by glutaraldehyde crosslinking. We have also collected data on ribonuclease S crystals at low pH in an attempt to study the onset of pH denaturation. The resolution of the datasets range from 1.9 to 3.0 A. Analysis of the structures reveals an increase in disorder with increasing urea concentration. In the 5 M urea structure, this increase in disorder is apparent all over the structure but is larger in loop and helical regions than in the beta strands. The low pH structure shows a very similar pattern of increased disorder. In addition there is a major change in the position of the main chain (> 1 A) in the 65-72 turn region. This region has previously been shown to be involved in one of the initial steps of unfolding in the reduction of ribonuclease A. Crystallographic analyses in the presence of denaturant, when combined with controlled crosslinking, can thus provide detailed structural information that is related to the initial steps of unfolding in solution. Proteins 1999;36:282-294.


  • Organizational Affiliation

    Molecular Biophysics Unit, Indian Institute of Science, Bangalore, India.


Macromolecules

Find similar proteins by:  Sequence   |   3D Structure  

Entity ID: 1
MoleculeChains Sequence LengthOrganismDetailsImage
PROTEIN (RIBONUCLEASE S)15synthetic constructMutation(s): 0 
UniProt
Find proteins for P61823 (Bos taurus)
Explore P61823 
Go to UniProtKB:  P61823
Entity Groups  
Sequence Clusters30% Identity50% Identity70% Identity90% Identity95% Identity100% Identity
UniProt GroupP61823
Sequence Annotations
Expand
  • Reference Sequence
Find similar proteins by:  (by identity cutoff)  |  3D Structure
Entity ID: 2
MoleculeChains Sequence LengthOrganismDetailsImage
PROTEIN (RIBONUCLEASE S)101Bos taurusMutation(s): 0 
UniProt
Find proteins for P61823 (Bos taurus)
Explore P61823 
Go to UniProtKB:  P61823
Entity Groups  
Sequence Clusters30% Identity50% Identity70% Identity90% Identity95% Identity100% Identity
UniProt GroupP61823
Sequence Annotations
Expand
  • Reference Sequence
Small Molecules
Ligands 1 Unique
IDChains Name / Formula / InChI Key2D Diagram3D Interactions
SO4
Query on SO4

Download Ideal Coordinates CCD File 
C [auth B]SULFATE ION
O4 S
QAOWNCQODCNURD-UHFFFAOYSA-L
Experimental Data & Validation

Experimental Data

  • Method: X-RAY DIFFRACTION
  • Resolution: 3.00 Å
  • R-Value Free: 0.253 
  • R-Value Work: 0.175 
  • Space Group: P 31 2 1
Unit Cell:
Length ( Å )Angle ( ˚ )
a = 44.8α = 90
b = 44.8β = 90
c = 98.62γ = 120
Software Package:
Software NamePurpose
XDSdata scaling
AUTOMARdata reduction
AMoREphasing
X-PLORrefinement
XDSdata reduction

Structure Validation

View Full Validation Report


Entry History 

Deposition Data

Revision History  (Full details and data files)

  • Version 1.0: 1999-05-07
    Type: Initial release
  • Version 1.1: 2008-04-26
    Changes: Version format compliance
  • Version 1.2: 2011-07-13
    Changes: Version format compliance
  • Version 1.3: 2017-10-04
    Changes: Refinement description
  • Version 1.4: 2023-08-09
    Changes: Data collection, Database references, Derived calculations, Refinement description