4GU0

Crystal structure of LSD2 with H3


Experimental Data Snapshot

  • Method: X-RAY DIFFRACTION
  • Resolution: 3.10 Å
  • R-Value Free: 0.221 
  • R-Value Work: 0.204 
  • R-Value Observed: 0.205 

wwPDB Validation   3D Report Full Report


Ligand Structure Quality Assessment 


This is version 1.2 of the entry. See complete history


Literature

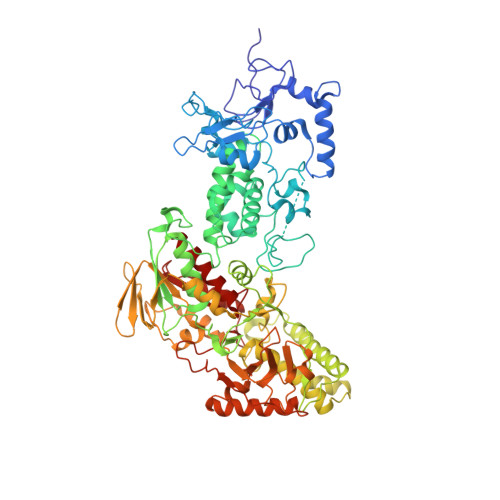
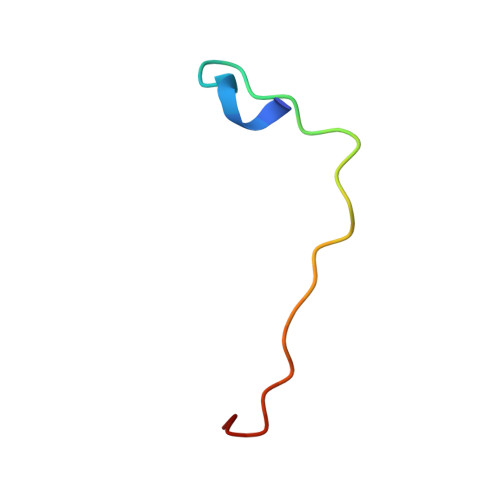
Structural insight into substrate recognition by histone demethylase LSD2/KDM1b

Chen, F.Yang, H.Dong, Z.Fang, J.Wang, P.Zhu, T.Gong, W.Fang, R.Shi, Y.G.Li, Z.Xu, Y.

(2013) Cell Res 23: 306-309


Macromolecules
Find similar proteins by:  (by identity cutoff)  |  3D Structure
Entity ID: 1
MoleculeChains Sequence LengthOrganismDetailsImage
Lysine-specific histone demethylase 1B
A, B, C, D
776Homo sapiensMutation(s): 0 
Gene Names: LSD2
EC: 1
UniProt & NIH Common Fund Data Resources
Find proteins for Q8NB78 (Homo sapiens)
Explore Q8NB78 
Go to UniProtKB:  Q8NB78
PHAROS:  Q8NB78
GTEx:  ENSG00000165097 
Entity Groups  
Sequence Clusters30% Identity50% Identity70% Identity90% Identity95% Identity100% Identity
UniProt GroupQ8NB78
Sequence Annotations
Expand
  • Reference Sequence
Find similar proteins by:  (by identity cutoff)  |  3D Structure
Entity ID: 2
MoleculeChains Sequence LengthOrganismDetailsImage
Histone H3.3
E, F
26Homo sapiensMutation(s): 1 
UniProt & NIH Common Fund Data Resources
Find proteins for P84243 (Homo sapiens)
Explore P84243 
Go to UniProtKB:  P84243
PHAROS:  P84243
Entity Groups  
Sequence Clusters30% Identity50% Identity70% Identity90% Identity95% Identity100% Identity
UniProt GroupP84243
Sequence Annotations
Expand
  • Reference Sequence
Small Molecules
Ligands 2 Unique
IDChains Name / Formula / InChI Key2D Diagram3D Interactions
FAD
Query on FAD

Download Ideal Coordinates CCD File 
G [auth A],
K [auth B],
O [auth C],
S [auth D]
FLAVIN-ADENINE DINUCLEOTIDE
C27 H33 N9 O15 P2
VWWQXMAJTJZDQX-UYBVJOGSSA-N
ZN
Query on ZN

Download Ideal Coordinates CCD File 
H [auth A]
I [auth A]
J [auth A]
L [auth B]
M [auth B]
H [auth A],
I [auth A],
J [auth A],
L [auth B],
M [auth B],
N [auth B],
P [auth C],
Q [auth C],
R [auth C],
T [auth D],
U [auth D],
V [auth D]
ZINC ION
Zn
PTFCDOFLOPIGGS-UHFFFAOYSA-N
Experimental Data & Validation

Experimental Data

  • Method: X-RAY DIFFRACTION
  • Resolution: 3.10 Å
  • R-Value Free: 0.221 
  • R-Value Work: 0.204 
  • R-Value Observed: 0.205 
  • Space Group: P 1
Unit Cell:
Length ( Å )Angle ( ˚ )
a = 101.843α = 94.47
b = 108.926β = 112.34
c = 120.825γ = 117.95
Software Package:
Software NamePurpose
HKL-2000data collection
PHASERphasing
PHENIXrefinement
HKL-2000data reduction
HKL-2000data scaling

Structure Validation

View Full Validation Report


Ligand Structure Quality Assessment 


Entry History 

Deposition Data

Revision History  (Full details and data files)

  • Version 1.0: 2013-02-13
    Type: Initial release
  • Version 1.1: 2013-07-10
    Changes: Database references
  • Version 1.2: 2023-11-08
    Changes: Data collection, Database references, Derived calculations, Refinement description