


Structure of a glycosomal glyceraldehyde 3-phosphate dehydrogenase from Trypanosoma brucei
Seattle Structural Genomics Center for Infectious Disease (SSGCID), Abendroth, J., Lorimer, D., Edwards, T.E.To be published.
Experimental Data Snapshot
Entity ID: 1 | |||||
|---|---|---|---|---|---|
| Molecule | Chains | Sequence Length | Organism | Details | Image |
| Glyceraldehyde 3-phosphate dehydrogenase, cytosolic | 339 | Trypanosoma brucei brucei TREU927 | Mutation(s): 0 Gene Names: Tb10.6k15.3850 EC: 1.2.1.12 | 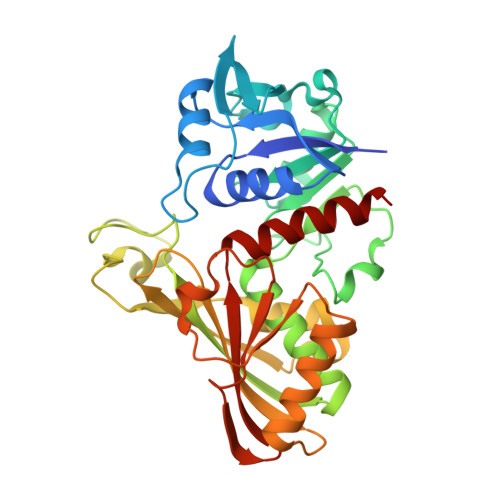 | |
UniProt | |||||
Find proteins for Q38AR9 (Trypanosoma brucei brucei (strain 927/4 GUTat10.1)) Explore Q38AR9 Go to UniProtKB: Q38AR9 | |||||
Entity Groups | |||||
| Sequence Clusters | 30% Identity50% Identity70% Identity90% Identity95% Identity100% Identity | ||||
| UniProt Group | Q38AR9 | ||||
Sequence AnnotationsExpand | |||||
| |||||
| Ligands 2 Unique | |||||
|---|---|---|---|---|---|
| ID | Chains | Name / Formula / InChI Key | 2D Diagram | 3D Interactions | |
| NAD Query on NAD | E [auth A], G [auth B], I [auth C], J [auth D] | NICOTINAMIDE-ADENINE-DINUCLEOTIDE C21 H27 N7 O14 P2 BAWFJGJZGIEFAR-NNYOXOHSSA-N |  | ||
| MG Query on MG | F [auth A], H [auth B], K [auth D] | MAGNESIUM ION Mg JLVVSXFLKOJNIY-UHFFFAOYSA-N |  | ||
| Length ( Å ) | Angle ( ˚ ) |
|---|---|
| a = 86.7 | α = 90 |
| b = 86.7 | β = 90 |
| c = 701.37 | γ = 120 |
| Software Name | Purpose |
|---|---|
| XDS | data reduction |
| XSCALE | data scaling |
| PHASER | phasing |
| PDB_EXTRACT | data extraction |
| ARP | model building |
| PHENIX | refinement |
RCSB PDB (citation) is hosted by
RCSB PDB is a member of the

