


Structure of the alpha-tubulin acetyltransferase alpha-TAT1/Mec-17 in complex with CoA
Yuzawa, S., Kamakura, S., Sumimoto, H.To be published.
Experimental Data Snapshot
Entity ID: 1 | |||||
|---|---|---|---|---|---|
| Molecule | Chains | Sequence Length | Organism | Details | Image |
| Alpha-tubulin N-acetyltransferase 1 | 201 | Homo sapiens | Mutation(s): 0 Gene Names: ATAT1, C6orf134, MEC17, Nbla00487 EC: 2.3.1.108 | 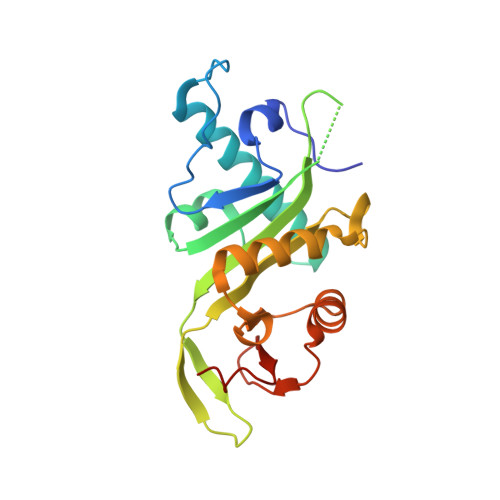 | |
UniProt & NIH Common Fund Data Resources | |||||
Find proteins for Q5SQI0 (Homo sapiens) Explore Q5SQI0 Go to UniProtKB: Q5SQI0 | |||||
PHAROS: Q5SQI0 GTEx: ENSG00000137343 | |||||
Entity Groups | |||||
| Sequence Clusters | 30% Identity50% Identity70% Identity90% Identity95% Identity100% Identity | ||||
| UniProt Group | Q5SQI0 | ||||
Sequence AnnotationsExpand | |||||
| |||||
| Ligands 2 Unique | |||||
|---|---|---|---|---|---|
| ID | Chains | Name / Formula / InChI Key | 2D Diagram | 3D Interactions | |
| COA Query on COA | B [auth A] | COENZYME A C21 H36 N7 O16 P3 S RGJOEKWQDUBAIZ-IBOSZNHHSA-N |  | ||
| BR Query on BR | C [auth A] | BROMIDE ION Br CPELXLSAUQHCOX-UHFFFAOYSA-M |  | ||
| Length ( Å ) | Angle ( ˚ ) |
|---|---|
| a = 42.849 | α = 90 |
| b = 121.938 | β = 90 |
| c = 37.397 | γ = 90 |
| Software Name | Purpose |
|---|---|
| HKL-2000 | data reduction |
| HKL-2000 | data scaling |
| PHASER | phasing |
| Coot | data extraction |
| PHENIX | refinement |
| HKL | data reduction |
| HKL | data scaling |
RCSB PDB (citation) is hosted by
RCSB PDB is a member of the

