


Crystal structure of N- and C-terminal regions of flagellin
Maruyama, Y., Momma, M., Mikami, B., Hashimoto, W., Murata, K.To be published.
Experimental Data Snapshot
wwPDB Validation 3D Report Full Report

Entity ID: 1 | |||||
|---|---|---|---|---|---|
| Molecule | Chains | Sequence Length | Organism | Details | Image |
| Flagellin homolog | 326 | Sphingomonas sp. A1 | Mutation(s): 0 | 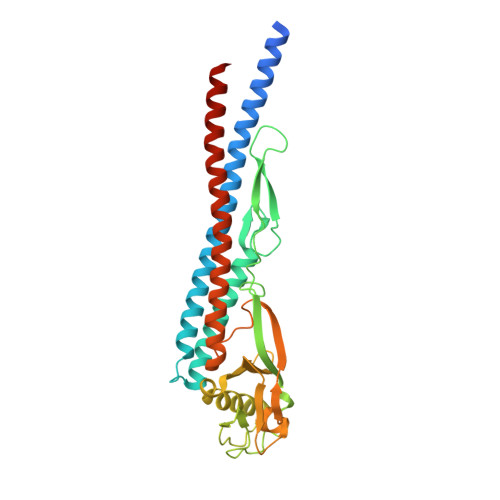 | |
UniProt | |||||
Find proteins for Q2PHB2 (Sphingomonas sp. A1) Explore Q2PHB2 Go to UniProtKB: Q2PHB2 | |||||
Entity Groups | |||||
| Sequence Clusters | 30% Identity50% Identity70% Identity90% Identity95% Identity100% Identity | ||||
| UniProt Group | Q2PHB2 | ||||
Sequence AnnotationsExpand | |||||
| |||||
| Length ( Å ) | Angle ( ˚ ) |
|---|---|
| a = 49.894 | α = 90 |
| b = 71.317 | β = 117.13 |
| c = 50.976 | γ = 90 |
| Software Name | Purpose |
|---|---|
| MOLREP | phasing |
| REFMAC | refinement |
| HKL-2000 | data reduction |
| HKL-2000 | data scaling |
RCSB PDB (citation) is hosted by
RCSB PDB is a member of the

