3LTF

Crystal Structure of the Drosophila Epidermal Growth Factor Receptor ectodomain in complex with Spitz


Experimental Data Snapshot

  • Method: X-RAY DIFFRACTION
  • Resolution: 3.20 Å
  • R-Value Free: 0.275 
  • R-Value Work: 0.237 
  • R-Value Observed: 0.240 

wwPDB Validation   3D Report Full Report


Ligand Structure Quality Assessment 


This is version 2.1 of the entry. See complete history


Literature

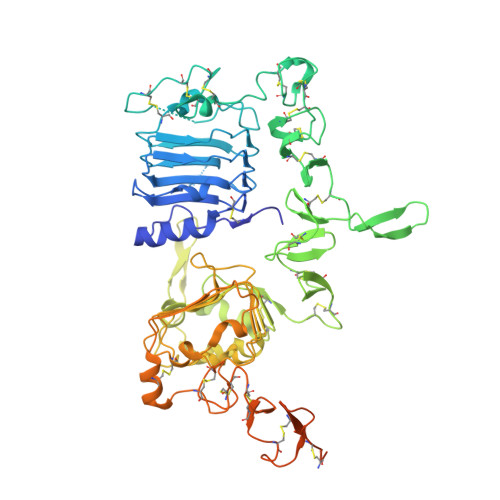
Structural basis for negative cooperativity in growth factor binding to an EGF receptor.

Alvarado, D.Klein, D.E.Lemmon, M.A.

(2010) Cell 142: 568-579

  • DOI: https://doi.org/10.1016/j.cell.2010.07.015
  • Primary Citation of Related Structures:  
    3LTF, 3LTG

  • PubMed Abstract: 

    Transmembrane signaling by the epidermal growth factor receptor (EGFR) involves ligand-induced dimerization and allosteric regulation of the intracellular tyrosine kinase domain. Crystallographic studies have shown how ligand binding induces dimerization of the EGFR extracellular region but cannot explain the "high-affinity" and "low-affinity" classes of cell-surface EGF-binding sites inferred from curved Scatchard plots. From a series of crystal structures of the Drosophila EGFR extracellular region, we show here how Scatchard plot curvature arises from negatively cooperative ligand binding. The first ligand-binding event induces formation of an asymmetric dimer with only one bound ligand. The unoccupied site in this dimer is structurally restrained, leading to reduced affinity for binding of the second ligand, and thus negative cooperativity. Our results explain the cell-surface binding characteristics of EGF receptors and suggest how individual EGFR ligands might stabilize distinct dimeric species with different signaling properties.


  • Organizational Affiliation

    Department of Biochemistry and Biophysics, University of Pennsylvania School of Medicine, Philadelphia, PA 19104-6059, USA.


Macromolecules
Find similar proteins by:  (by identity cutoff)  |  3D Structure
Entity ID: 1
MoleculeChains Sequence LengthOrganismDetailsImage
Epidermal growth factor receptorA,
B [auth C]
601Drosophila melanogasterMutation(s): 0 
Gene Names: EgfrDmel_CG10079torpedodEGFRc-erbBDERtop
EC: 2.7.10
UniProt
Find proteins for P04412 (Drosophila melanogaster)
Explore P04412 
Go to UniProtKB:  P04412
Entity Groups  
Sequence Clusters30% Identity50% Identity70% Identity90% Identity95% Identity100% Identity
UniProt GroupP04412
Sequence Annotations
Expand
  • Reference Sequence
Find similar proteins by:  (by identity cutoff)  |  3D Structure
Entity ID: 2
MoleculeChains Sequence LengthOrganismDetailsImage
Protein spitzC [auth D],
D [auth B]
58Drosophila melanogasterMutation(s): 0 
Gene Names: CG10334spiSpitz
UniProt
Find proteins for Q01083 (Drosophila melanogaster)
Explore Q01083 
Go to UniProtKB:  Q01083
Entity Groups  
Sequence Clusters30% Identity50% Identity70% Identity90% Identity95% Identity100% Identity
UniProt GroupQ01083
Sequence Annotations
Expand
  • Reference Sequence
Oligosaccharides

Help

Entity ID: 3
MoleculeChains Length2D Diagram Glycosylation3D Interactions
alpha-D-mannopyranose-(1-4)-alpha-D-mannopyranose-(1-3)-[alpha-D-mannopyranose-(1-6)]alpha-D-mannopyranose-(1-4)-2-acetamido-2-deoxy-beta-D-glucopyranose-(1-4)-2-acetamido-2-deoxy-beta-D-glucopyranose
E
6N-Glycosylation
Glycosylation Resources
GlyTouCan:  G10025ZX
GlyCosmos:  G10025ZX
GlyGen:  G10025ZX
Entity ID: 4
MoleculeChains Length2D Diagram Glycosylation3D Interactions
2-acetamido-2-deoxy-beta-D-glucopyranose-(1-4)-2-acetamido-2-deoxy-beta-D-glucopyranose
F
2N-Glycosylation
Glycosylation Resources
GlyTouCan:  G42666HT
GlyCosmos:  G42666HT
GlyGen:  G42666HT
Entity ID: 5
MoleculeChains Length2D Diagram Glycosylation3D Interactions
alpha-D-mannopyranose-(1-3)-alpha-D-mannopyranose-(1-4)-2-acetamido-2-deoxy-beta-D-glucopyranose-(1-4)-2-acetamido-2-deoxy-beta-D-glucopyranose
G
4N-Glycosylation
Glycosylation Resources
GlyTouCan:  G48068RF
GlyCosmos:  G48068RF
GlyGen:  G48068RF
Experimental Data & Validation

Experimental Data

  • Method: X-RAY DIFFRACTION
  • Resolution: 3.20 Å
  • R-Value Free: 0.275 
  • R-Value Work: 0.237 
  • R-Value Observed: 0.240 
  • Space Group: P 21 21 21
Unit Cell:
Length ( Å )Angle ( ˚ )
a = 118.208α = 90
b = 124.239β = 90
c = 186.508γ = 90
Software Package:
Software NamePurpose
HKL-2000data collection
PHASERphasing
REFMACrefinement
HKL-2000data reduction
HKL-2000data scaling

Structure Validation

View Full Validation Report


Ligand Structure Quality Assessment 


Entry History 

Deposition Data

Revision History  (Full details and data files)

  • Version 1.0: 2010-08-25
    Type: Initial release
  • Version 1.1: 2011-07-13
    Changes: Version format compliance
  • Version 2.0: 2020-07-29
    Type: Remediation
    Reason: Carbohydrate remediation
    Changes: Advisory, Atomic model, Data collection, Database references, Derived calculations, Structure summary
  • Version 2.1: 2023-09-06
    Changes: Data collection, Database references, Refinement description, Structure summary