2FA4

Crystal Structure of Oxidized Form from Saccharomyces cerevisiae


Experimental Data Snapshot

  • Method: X-RAY DIFFRACTION
  • Resolution: 2.38 Å
  • R-Value Free: 0.259 
  • R-Value Work: 0.206 
  • R-Value Observed: 0.208 

wwPDB Validation   3D Report Full Report


This is version 1.3 of the entry. See complete history


Literature

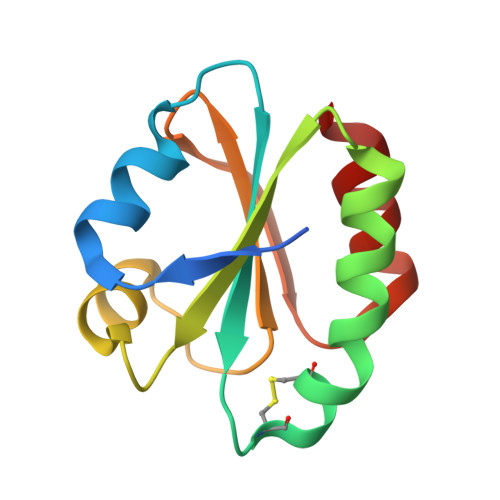
Crystal structure of the yeast cytoplasmic thioredoxin Trx2

Bao, R.Chen, Y.Tang, Y.J.Janin, J.Zhou, C.Z.

(2007) Proteins 66: 246-249


Macromolecules
Find similar proteins by:  (by identity cutoff)  |  3D Structure
Entity ID: 1
MoleculeChains Sequence LengthOrganismDetailsImage
Thioredoxin II
A, B
111Saccharomyces cerevisiaeMutation(s): 0 
UniProt
Find proteins for P22803 (Saccharomyces cerevisiae (strain ATCC 204508 / S288c))
Explore P22803 
Go to UniProtKB:  P22803
Entity Groups  
Sequence Clusters30% Identity50% Identity70% Identity90% Identity95% Identity100% Identity
UniProt GroupP22803
Sequence Annotations
Expand
  • Reference Sequence
Experimental Data & Validation

Experimental Data

  • Method: X-RAY DIFFRACTION
  • Resolution: 2.38 Å
  • R-Value Free: 0.259 
  • R-Value Work: 0.206 
  • R-Value Observed: 0.208 
  • Space Group: P 41 21 2
Unit Cell:
Length ( Å )Angle ( ˚ )
a = 83.151α = 90
b = 83.151β = 90
c = 64.732γ = 90
Software Package:
Software NamePurpose
REFMACrefinement
MAR345data collection
MOSFLMdata reduction
MOLREPphasing

Structure Validation

View Full Validation Report


Entry History 

Deposition Data

Revision History  (Full details and data files)

  • Version 1.0: 2006-12-06
    Type: Initial release
  • Version 1.1: 2008-05-01
    Changes: Version format compliance
  • Version 1.2: 2011-07-13
    Changes: Version format compliance
  • Version 1.3: 2017-10-18
    Changes: Refinement description