1UH5

Crystal Structure of Enoyl-ACP Reductase with Triclosan at 2.2angstroms


Experimental Data Snapshot

  • Method: X-RAY DIFFRACTION
  • Resolution: 2.20 Å
  • R-Value Free: 0.211 
  • R-Value Work: 0.180 
  • R-Value Observed: 0.180 

wwPDB Validation   3D Report Full Report


Ligand Structure Quality Assessment 


This is version 1.4 of the entry. See complete history


Literature

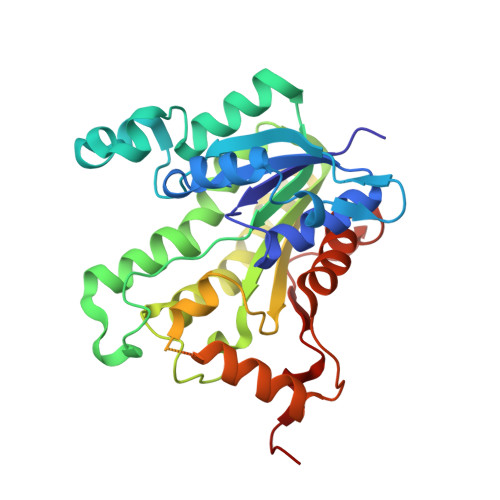
Structural basis for the variation in triclosan affinity to enoyl reductases.

Pidugu, L.S.Kapoor, M.Surolia, N.Surolia, A.Suguna, K.

(2004) J Mol Biol 343: 147-155

  • DOI: https://doi.org/10.1016/j.jmb.2004.08.033
  • Primary Citation of Related Structures:  
    1UH5, 1V35

  • PubMed Abstract: 

    Bacteria synthesize fatty acids in a dissociated type pathway different from that in humans. Enoyl acyl carrier protein reductase, which catalyzes the final step of fatty acid elongation, has been validated as a potential anti-microbial drug target. Triclosan is known to inhibit this enzyme effectively. Precise characterization of the mode of triclosan binding is required to develop highly specific inhibitors. With this in view, interactions between triclosan, the cofactor NADH/NAD+ and the enzyme from five different species, one plant and four of microbial origin, have been examined in the available crystal structures. A comparison of these structures shows major structural differences at the substrate/inhibitor/cofactor-binding loop. The analysis reveals that the conformation of this flexible loop and the binding affinities of triclosan to each of these enzymes are strongly correlated.


  • Organizational Affiliation

    Molecular Biophysics Unit, Indian Institute of Science, Bangalore 560 012.


Macromolecules
Find similar proteins by:  (by identity cutoff)  |  3D Structure
Entity ID: 1
MoleculeChains Sequence LengthOrganismDetailsImage
enoyl-ACP reductase
A, B
329Plasmodium falciparumMutation(s): 0 
Gene Names: FabI
EC: 1.3.1.9
UniProt
Find proteins for Q9BJJ9 (Plasmodium falciparum)
Explore Q9BJJ9 
Go to UniProtKB:  Q9BJJ9
Entity Groups  
Sequence Clusters30% Identity50% Identity70% Identity90% Identity95% Identity100% Identity
UniProt GroupQ9BJJ9
Sequence Annotations
Expand
  • Reference Sequence
Small Molecules
Binding Affinity Annotations 
IDSourceBinding Affinity
TCL BindingDB:  1UH5 Ki: min: 1.90e-3, max: 13.72 (nM) from 11 assay(s)
IC50: min: 49, max: 200 (nM) from 6 assay(s)
Experimental Data & Validation

Experimental Data

  • Method: X-RAY DIFFRACTION
  • Resolution: 2.20 Å
  • R-Value Free: 0.211 
  • R-Value Work: 0.180 
  • R-Value Observed: 0.180 
  • Space Group: P 43 21 2
Unit Cell:
Length ( Å )Angle ( ˚ )
a = 133.016α = 90
b = 133.016β = 90
c = 83.659γ = 90
Software Package:
Software NamePurpose
CNSrefinement
DENZOdata reduction
SCALEPACKdata scaling
AMoREphasing

Structure Validation

View Full Validation Report


Ligand Structure Quality Assessment 


Entry History 

Deposition Data

Revision History  (Full details and data files)

  • Version 1.0: 2004-09-28
    Type: Initial release
  • Version 1.1: 2008-04-27
    Changes: Version format compliance
  • Version 1.2: 2011-07-13
    Changes: Derived calculations, Version format compliance
  • Version 1.3: 2017-11-29
    Changes: Derived calculations
  • Version 1.4: 2023-10-25
    Changes: Data collection, Database references, Derived calculations, Refinement description