2F70

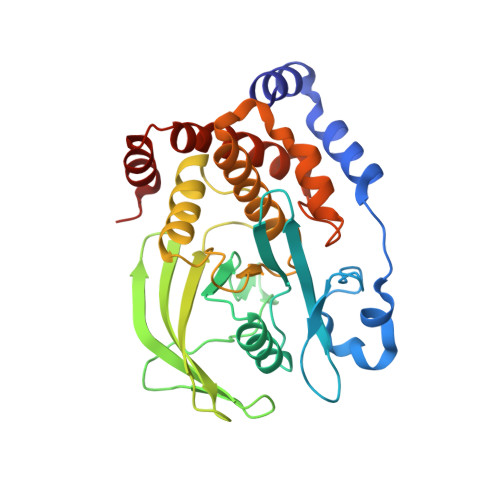
Protein tyrosine phosphatase 1B with sulfamic acid inhibitors


Experimental Data Snapshot

  • Method: X-RAY DIFFRACTION
  • Resolution: 2.12 Å
  • R-Value Free: 0.197 
  • R-Value Work: 0.158 
  • R-Value Observed: 0.160 

wwPDB Validation   3D Report Full Report


Ligand Structure Quality Assessment 


This is version 1.3 of the entry. See complete history


Literature

1,2,3,4-Tetrahydroisoquinolinyl sulfamic acids as phosphatase PTP1B inhibitors

Klopfenstein, S.R.Evdokimov, A.G.Colson, A.-O.Fairweather, N.T.Neuman, J.J.Maier, M.B.Gray, J.L.Gerwe, G.S.Stake, G.E.Howard, B.W.Farmer, J.A.Pokross, M.E.Downs, T.R.Kasibhatla, B.Peters, K.G.

(2006) Bioorg Med Chem Lett 16: 1574-1578

  • DOI: https://doi.org/10.1016/j.bmcl.2005.12.051
  • Primary Citation of Related Structures:  
    2F6T, 2F6V, 2F6W, 2F6Y, 2F6Z, 2F70, 2F71

  • PubMed Abstract: 

    High-throughput screening of the P&GP corporate repository against several protein tyrosine phosphatases identified the sulfamic acid moiety as potential phosphotyrosine mimetic. Incorporation of the sulfamic acid onto a 1,2,3,4-tetrahydroisoquinoline scaffold provided a promising starting point for PTP1B inhibitor design.


  • Organizational Affiliation

    Procter & Gamble Pharmaceuticals, Health Care Research Center, 8700 Mason-Montgomery Road, Mason, OH 45040, USA. klopfenstein.sr@pg.com


Macromolecules
Find similar proteins by:  (by identity cutoff)  |  3D Structure
Entity ID: 1
MoleculeChains Sequence LengthOrganismDetailsImage
Tyrosine-protein phosphatase, non-receptor type 1298Homo sapiensMutation(s): 0 
Gene Names: PTPN1PTP1B
EC: 3.1.3.48
UniProt & NIH Common Fund Data Resources
Find proteins for P18031 (Homo sapiens)
Explore P18031 
Go to UniProtKB:  P18031
PHAROS:  P18031
GTEx:  ENSG00000196396 
Entity Groups  
Sequence Clusters30% Identity50% Identity70% Identity90% Identity95% Identity100% Identity
UniProt GroupP18031
Sequence Annotations
Expand
  • Reference Sequence
Small Molecules
Binding Affinity Annotations 
IDSourceBinding Affinity
UN6 Binding MOAD:  2F70 IC50: 3.35e+4 (nM) from 1 assay(s)
BindingDB:  2F70 IC50: 3.35e+4 (nM) from 1 assay(s)
PDBBind:  2F70 IC50: 3.35e+4 (nM) from 1 assay(s)
Experimental Data & Validation

Experimental Data

  • Method: X-RAY DIFFRACTION
  • Resolution: 2.12 Å
  • R-Value Free: 0.197 
  • R-Value Work: 0.158 
  • R-Value Observed: 0.160 
  • Space Group: P 31 2 1
Unit Cell:
Length ( Å )Angle ( ˚ )
a = 88.44α = 90
b = 88.44β = 90
c = 104.619γ = 120
Software Package:
Software NamePurpose
REFMACrefinement
PDB_EXTRACTdata extraction
HKL-2000data reduction
SCALEPACKdata scaling
AMoREphasing

Structure Validation

View Full Validation Report


Ligand Structure Quality Assessment 


Entry History 

Deposition Data

Revision History  (Full details and data files)

  • Version 1.0: 2005-12-13
    Type: Initial release
  • Version 1.1: 2008-05-01
    Changes: Version format compliance
  • Version 1.2: 2011-07-13
    Changes: Advisory, Version format compliance
  • Version 1.3: 2023-08-23
    Changes: Data collection, Database references, Derived calculations, Refinement description