5L6Y

il13 in complex with tralokinumab


Experimental Data Snapshot

  • Method: X-RAY DIFFRACTION
  • Resolution: 1.99 Å
  • R-Value Free: 0.211 
  • R-Value Work: 0.189 
  • R-Value Observed: 0.190 

wwPDB Validation   3D Report Full Report


This is version 1.2 of the entry. See complete history


Literature

Structural Characterisation Reveals Mechanism of IL-13-Neutralising Monoclonal Antibody Tralokinumab as Inhibition of Binding to IL-13R alpha 1 and IL-13R alpha 2.

Popovic, B.Breed, J.Rees, D.G.Gardener, M.J.Vinall, L.M.Kemp, B.Spooner, J.Keen, J.Minter, R.Uddin, F.Colice, G.Wilkinson, T.Vaughan, T.May, R.D.

(2017) J Mol Biol 429: 208-219

  • DOI: https://doi.org/10.1016/j.jmb.2016.12.005
  • Primary Citation of Related Structures:  
    5L6Y

  • PubMed Abstract: 

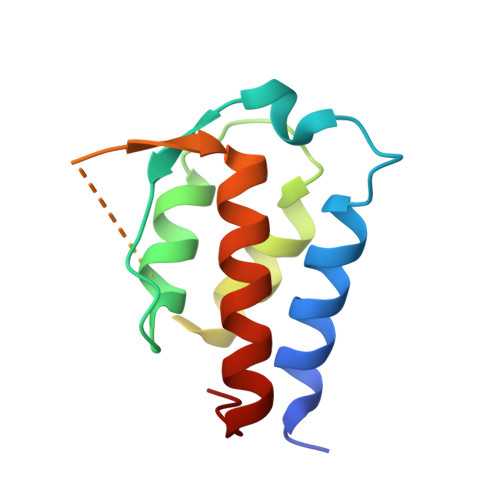
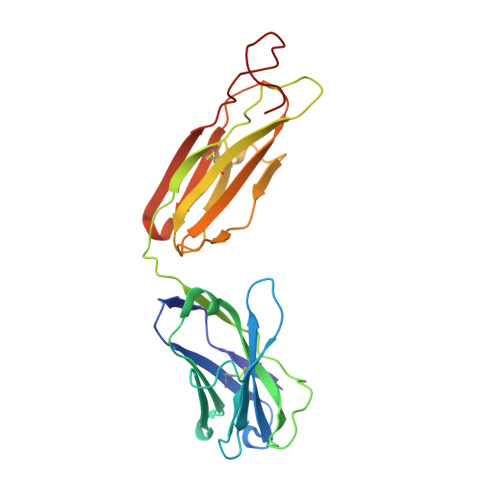
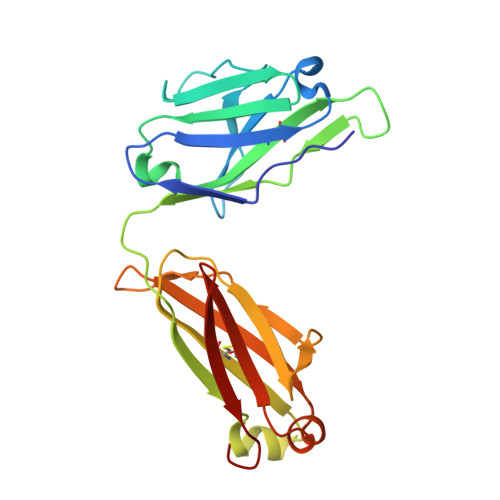
    Interleukin (IL)-13 is a pleiotropic T helper type 2 cytokine frequently associated with asthma and atopic dermatitis. IL-13-mediated signalling is initiated by binding to IL-13Rα1, which then recruits IL-4Rα to form a heterodimeric receptor complex. IL-13 also binds to IL-13Rα2, considered as either a decoy or a key mediator of fibrosis. IL-13-neutralising antibodies act by preventing IL-13 binding to IL-13Rα1, IL-4Rα and/or IL-13Rα2. Tralokinumab (CAT-354) is an IL-13-neutralising human IgG4 monoclonal antibody that has shown clinical benefit in patients with asthma. To decipher how tralokinumab inhibits the effects of IL-13, we determined the structure of tralokinumab Fab in complex with human IL-13 to 2 Å resolution. The structure analysis reveals that tralokinumab prevents IL-13 from binding to both IL-13Rα1 and IL-13Rα2. This is supported by biochemical ligand-receptor interaction assay data. The tralokinumab epitope is mainly composed of residues in helices D and A of IL-13. It is mostly light chain complementarity-determining regions that are driving paratope interactions; the variable light complementarity-determining region 2 plays a key role by providing residue contacts for a network of hydrogen bonds and a salt bridge in the core of binding. The key residues within the paratope contributing to binding were identified as Asp50, Asp51, Ser30 and Lys31. This study demonstrates that tralokinumab prevents the IL-13 pharmacodynamic effect by binding to IL-13 helices A and D, thus preventing IL-13 from interacting with IL-13Rα1 and IL-13Rα2.


  • Organizational Affiliation

    Department of Antibody Discovery and Protein Engineering, MedImmune Ltd., Granta Park, Cambridge CB21 6GH, UK. Electronic address: popovicb@medimmune.com.


Macromolecules
Find similar proteins by:  (by identity cutoff)  |  3D Structure
Entity ID: 1
MoleculeChains Sequence LengthOrganismDetailsImage
Interleukin-13A [auth C]112Homo sapiensMutation(s): 0 
Gene Names: IL13NC30
UniProt & NIH Common Fund Data Resources
Find proteins for P35225 (Homo sapiens)
Explore P35225 
Go to UniProtKB:  P35225
PHAROS:  P35225
GTEx:  ENSG00000169194 
Entity Groups  
Sequence Clusters30% Identity50% Identity70% Identity90% Identity95% Identity100% Identity
UniProt GroupP35225
Sequence Annotations
Expand
  • Reference Sequence
Find similar proteins by:  (by identity cutoff)  |  3D Structure
Entity ID: 2
MoleculeChains Sequence LengthOrganismDetailsImage
tralokinumab FAb digest VHB [auth H]238Homo sapiensMutation(s): 0 
Entity Groups  
Sequence Clusters30% Identity50% Identity70% Identity90% Identity95% Identity100% Identity
Sequence Annotations
Expand
  • Reference Sequence
Find similar proteins by:  (by identity cutoff)  |  3D Structure
Entity ID: 3
MoleculeChains Sequence LengthOrganismDetailsImage
tralokiumab FAb digest VLC [auth L]214Homo sapiensMutation(s): 0 
Entity Groups  
Sequence Clusters30% Identity50% Identity70% Identity90% Identity95% Identity100% Identity
Sequence Annotations
Expand
  • Reference Sequence
Small Molecules
Ligands 1 Unique
IDChains Name / Formula / InChI Key2D Diagram3D Interactions
FMT
Query on FMT

Download Ideal Coordinates CCD File 
D [auth H]
E [auth H]
F [auth H]
G [auth H]
H
D [auth H],
E [auth H],
F [auth H],
G [auth H],
H,
I [auth L],
J [auth L],
K [auth L],
L,
M [auth L],
N [auth L],
O [auth L],
P [auth L],
Q [auth L],
R [auth L]
FORMIC ACID
C H2 O2
BDAGIHXWWSANSR-UHFFFAOYSA-N
Experimental Data & Validation

Experimental Data

  • Method: X-RAY DIFFRACTION
  • Resolution: 1.99 Å
  • R-Value Free: 0.211 
  • R-Value Work: 0.189 
  • R-Value Observed: 0.190 
  • Space Group: P 1
Unit Cell:
Length ( Å )Angle ( ˚ )
a = 50.998α = 107.91
b = 53.195β = 101.42
c = 62.05γ = 96.94
Software Package:
Software NamePurpose
BUSTERrefinement
XDSdata reduction
XDSdata scaling
PHASERphasing

Structure Validation

View Full Validation Report


Entry History 

Deposition Data

  • Released Date: 2016-12-21 
  • Deposition Author(s): Breed, J.

Revision History  (Full details and data files)

  • Version 1.0: 2016-12-21
    Type: Initial release
  • Version 1.1: 2016-12-28
    Changes: Database references
  • Version 1.2: 2017-01-25
    Changes: Database references