5UJT

Crystal structure of human HLA-DQ8 in complex with insulin mimotope binding in register 3


Experimental Data Snapshot

  • Method: X-RAY DIFFRACTION
  • Resolution: 1.94 Å
  • R-Value Free: 0.238 
  • R-Value Work: 0.209 
  • R-Value Observed: 0.210 

wwPDB Validation   3D Report Full Report


Ligand Structure Quality Assessment 


This is version 2.1 of the entry. See complete history


Literature

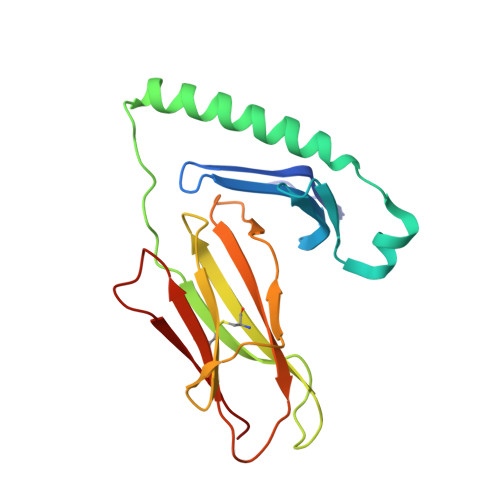
C-terminal modification of the insulin B:11-23 peptide creates superagonists in mouse and human type 1 diabetes.

Wang, Y.Sosinowski, T.Novikov, A.Crawford, F.Neau, D.B.Yang, J.Kwok, W.W.Marrack, P.Kappler, J.W.Dai, S.

(2018) Proc Natl Acad Sci U S A 115: 162-167

  • DOI: https://doi.org/10.1073/pnas.1716527115
  • Primary Citation of Related Structures:  
    5UJT, 6BLQ, 6BLR, 6BLX

  • PubMed Abstract: 

    A polymorphism at β57 in some major histocompatibility complex class II (MHCII) alleles of rodents and humans is associated with a high risk for developing type 1 diabetes (T1D). However, a highly diabetogenic insulin B chain epitope within the B:9-23 peptide is presented poorly by these alleles to a variety of mouse and human CD4 T cells isolated from either nonobese diabetic (NOD) mice or humans with T1D. We have shown for both species that mutations at the C-terminal end of this epitope dramatically improve presentation to these T cells. Here we present the crystal structures of these mutated peptides bound to mouse IA g7 and human HLA-DQ8 that show how the mutations function to improve T-cell activation. In both peptide binding grooves, the mutation of B:22R to E in the peptide changes a highly unfavorable side chain for the p9 pocket to an optimal one that is dependent on the β57 polymorphism, accounting for why these peptides bind much better to these MHCIIs. Furthermore, a second mutation of the adjacent B:21 (E to G) removes a side chain from the surface of the complex that is highly unfavorable for a subset of NOD mouse CD4 cells, thereby greatly enhancing their response to the complex. These results point out the similarities between the mouse and human responses to this B chain epitope in T1D and suggest there may be common posttranslational modifications at the C terminus of the peptide in vivo to create the pathogenic epitopes in both species.


  • Organizational Affiliation

    Department of Biomedical Research, National Jewish Health, Denver, CO 80206.


Macromolecules
Find similar proteins by:  (by identity cutoff)  |  3D Structure
Entity ID: 1
MoleculeChains Sequence LengthOrganismDetailsImage
MHC class II antigen
A, D, G
185Homo sapiensMutation(s): 0 
Gene Names: HLA-DQA1
UniProt
Find proteins for Q5Y7C3 (Homo sapiens)
Explore Q5Y7C3 
Go to UniProtKB:  Q5Y7C3
Entity Groups  
Sequence Clusters30% Identity50% Identity70% Identity90% Identity95% Identity100% Identity
UniProt GroupQ5Y7C3
Sequence Annotations
Expand
  • Reference Sequence
Find similar proteins by:  (by identity cutoff)  |  3D Structure
Entity ID: 2
MoleculeChains Sequence LengthOrganismDetailsImage
MHC class II HLA-DQ-beta-1
B, E, H
189Homo sapiensMutation(s): 0 
Gene Names: HLA-DQB1
UniProt
Find proteins for O19707 (Homo sapiens)
Explore O19707 
Go to UniProtKB:  O19707
Entity Groups  
Sequence Clusters30% Identity50% Identity70% Identity90% Identity95% Identity100% Identity
UniProt GroupO19707
Sequence Annotations
Expand
  • Reference Sequence

Find similar proteins by:  Sequence   |   3D Structure  

Entity ID: 3
MoleculeChains Sequence LengthOrganismDetailsImage
insulin mimotope
C, F, I
16Homo sapiensMutation(s): 0 
Entity Groups  
Sequence Clusters30% Identity50% Identity70% Identity90% Identity95% Identity100% Identity
Sequence Annotations
Expand
  • Reference Sequence
Oligosaccharides

Help

Entity ID: 4
MoleculeChains Length2D Diagram Glycosylation3D Interactions
2-acetamido-2-deoxy-beta-D-glucopyranose-(1-3)-[2-acetamido-2-deoxy-beta-D-glucopyranose-(1-4)]2-acetamido-2-deoxy-beta-D-glucopyranose
J
3N-Glycosylation
Glycosylation Resources
GlyTouCan:  G26744ZJ
GlyCosmos:  G26744ZJ
GlyGen:  G26744ZJ
Experimental Data & Validation

Experimental Data

  • Method: X-RAY DIFFRACTION
  • Resolution: 1.94 Å
  • R-Value Free: 0.238 
  • R-Value Work: 0.209 
  • R-Value Observed: 0.210 
  • Space Group: P 21 21 21
Unit Cell:
Length ( Å )Angle ( ˚ )
a = 72.038α = 90
b = 138.767β = 90
c = 159.735γ = 90
Software Package:
Software NamePurpose
PHENIXrefinement
HKL-2000data reduction
HKL-2000data scaling
PHASERphasing

Structure Validation

View Full Validation Report


Ligand Structure Quality Assessment 


Entry History 

Deposition Data

Revision History  (Full details and data files)

  • Version 1.0: 2017-12-20
    Type: Initial release
  • Version 1.1: 2018-01-03
    Changes: Database references
  • Version 1.2: 2018-01-10
    Changes: Database references
  • Version 2.0: 2020-07-29
    Type: Remediation
    Reason: Carbohydrate remediation
    Changes: Advisory, Atomic model, Data collection, Derived calculations, Structure summary
  • Version 2.1: 2023-10-04
    Changes: Data collection, Database references, Derived calculations, Refinement description, Structure summary