3NCL

Crystal Structure of MT-SP1 bound to Benzamidine Phosphonate Inhibitor


Experimental Data Snapshot

  • Method: X-RAY DIFFRACTION
  • Resolution: 1.19 Å
  • R-Value Free: 0.156 
  • R-Value Work: 0.133 
  • R-Value Observed: 0.134 

wwPDB Validation   3D Report Full Report


Ligand Structure Quality Assessment 


This is version 1.3 of the entry. See complete history


Literature

Peptide length and leaving-group sterics influence potency of Peptide phosphonate protease inhibitors.

Brown, C.M.Ray, M.Eroy-Reveles, A.A.Egea, P.Tajon, C.Craik, C.S.

(2011) Chem Biol 18: 48-57

  • DOI: https://doi.org/10.1016/j.chembiol.2010.11.007
  • Primary Citation of Related Structures:  
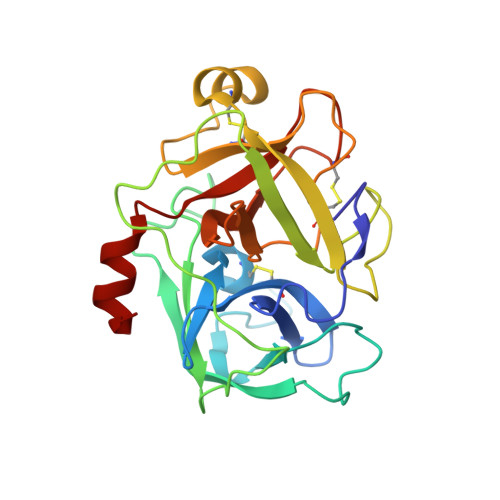
    3NCL

  • PubMed Abstract: 

    The ability to follow enzyme activity in a cellular context represents a challenging technological frontier that impacts fields ranging from disease pathogenesis to epigenetics. Activity-based probes (ABPs) label the active form of an enzyme via covalent modification of catalytic residues. Here we present an analysis of parameters influencing potency of peptide phosphonate ABPs for trypsin-fold S1A proteases, an abundant and important class of enzymes with similar substrate specificities. We find that peptide length and stability influence potency more than sequence composition and present structural evidence that steric interactions at the prime-side of the substrate-binding cleft affect potency in a protease-dependent manner. We introduce guidelines for the design of peptide phosphonate ABPs and demonstrate their utility in a live-cell labeling application that specifically targets active S1A proteases at the cell surface of cancer cells.


  • Organizational Affiliation

    Graduate Group in Biochemistry and Molecular Biology, University of California, San Francisco, CA 94158, USA.


Macromolecules
Find similar proteins by:  (by identity cutoff)  |  3D Structure
Entity ID: 1
MoleculeChains Sequence LengthOrganismDetailsImage
Suppressor of tumorigenicity 14 protein241Homo sapiensMutation(s): 1 
Gene Names: ST14PRSS14SNC19TADG15
EC: 3.4.21.109
UniProt & NIH Common Fund Data Resources
Find proteins for Q9Y5Y6 (Homo sapiens)
Explore Q9Y5Y6 
Go to UniProtKB:  Q9Y5Y6
PHAROS:  Q9Y5Y6
GTEx:  ENSG00000149418 
Entity Groups  
Sequence Clusters30% Identity50% Identity70% Identity90% Identity95% Identity100% Identity
UniProt GroupQ9Y5Y6
Sequence Annotations
Expand
  • Reference Sequence
Experimental Data & Validation

Experimental Data

  • Method: X-RAY DIFFRACTION
  • Resolution: 1.19 Å
  • R-Value Free: 0.156 
  • R-Value Work: 0.133 
  • R-Value Observed: 0.134 
  • Space Group: C 1 2 1
Unit Cell:
Length ( Å )Angle ( ˚ )
a = 74.915α = 90
b = 80.24β = 95.82
c = 40.539γ = 90
Software Package:
Software NamePurpose
SCALAdata scaling
PHENIXrefinement
PDB_EXTRACTdata extraction
ELVESrefinement
MOSFLMdata reduction
PHASERphasing

Structure Validation

View Full Validation Report


Ligand Structure Quality Assessment 


Entry History 

Deposition Data

Revision History  (Full details and data files)

  • Version 1.0: 2011-02-16
    Type: Initial release
  • Version 1.1: 2011-07-13
    Changes: Version format compliance
  • Version 1.2: 2017-11-08
    Changes: Refinement description
  • Version 1.3: 2023-09-06
    Changes: Data collection, Database references, Derived calculations, Refinement description