


Crystal structure of mouse transaldolase
Kishishita, S., Murayama, K., Chen, L., Liu, Z.J., Wang, B.C., Shirouzu, M., Yokoyama, S.To be published.
Experimental Data Snapshot
wwPDB Validation 3D Report Full Report

Entity ID: 1 | |||||
|---|---|---|---|---|---|
| Molecule | Chains | Sequence Length | Organism | Details | Image |
| Transaldolase | 331 | Mus musculus | Mutation(s): 1 EC: 2.2.1.2 | 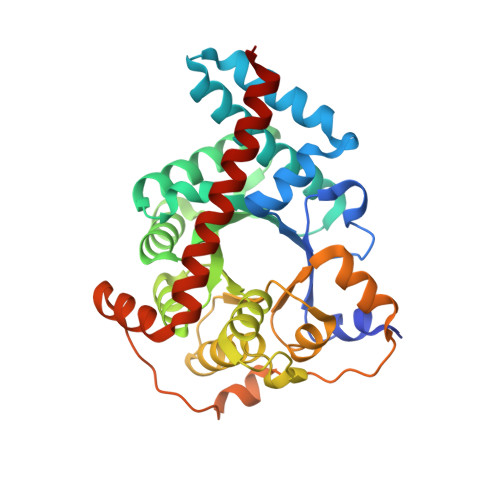 | |
UniProt | |||||
Find proteins for Q93092 (Mus musculus) Explore Q93092 Go to UniProtKB: Q93092 | |||||
Entity Groups | |||||
| Sequence Clusters | 30% Identity50% Identity70% Identity90% Identity95% Identity100% Identity | ||||
| UniProt Group | Q93092 | ||||
Sequence AnnotationsExpand | |||||
| |||||
| Ligands 1 Unique | |||||
|---|---|---|---|---|---|
| ID | Chains | Name / Formula / InChI Key | 2D Diagram | 3D Interactions | |
| SO3 Query on SO3 | C [auth A], D [auth B] | SULFITE ION O3 S LSNNMFCWUKXFEE-UHFFFAOYSA-L |  | ||
| Length ( Å ) | Angle ( ˚ ) |
|---|---|
| a = 51.984 | α = 90 |
| b = 107.488 | β = 96.91 |
| c = 60.877 | γ = 90 |
| Software Name | Purpose |
|---|---|
| CNS | refinement |
| HKL-2000 | data reduction |
| HKL-2000 | data scaling |
| MOLREP | phasing |
RCSB PDB (citation) is hosted by
RCSB PDB is a member of the

