


Structure of the E9 DNase domain in comparison with the inhibited structure of the E9 DNase/Im9 complex
Kuhlmann, U.C., Pommer, A.J., Moore, G.R., James, R., Kleanthous, C., Hemmings, A.M.To be published.
Experimental Data Snapshot
wwPDB Validation 3D Report Full Report

Entity ID: 1 | |||||
|---|---|---|---|---|---|
| Molecule | Chains | Sequence Length | Organism | Details | Image |
| COLICIN E9 | A [auth B], B [auth C], C [auth D], D [auth E] | 134 | Escherichia coli | Mutation(s): 0 EC: 3.1.21.1 | 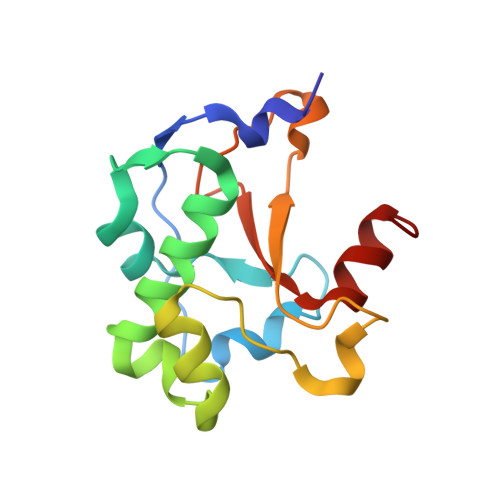 |
UniProt | |||||
Find proteins for P09883 (Escherichia coli) Explore P09883 Go to UniProtKB: P09883 | |||||
Entity Groups | |||||
| Sequence Clusters | 30% Identity50% Identity70% Identity90% Identity95% Identity100% Identity | ||||
| UniProt Group | P09883 | ||||
Sequence AnnotationsExpand | |||||
| |||||
| Ligands 2 Unique | |||||
|---|---|---|---|---|---|
| ID | Chains | Name / Formula / InChI Key | 2D Diagram | 3D Interactions | |
| PO4 Query on PO4 | E [auth B], G [auth C], I [auth D], K [auth E] | PHOSPHATE ION O4 P NBIIXXVUZAFLBC-UHFFFAOYSA-K |  | ||
| ZN Query on ZN | F [auth B], H [auth C], J [auth D], L [auth E] | ZINC ION Zn PTFCDOFLOPIGGS-UHFFFAOYSA-N |  | ||
| Length ( Å ) | Angle ( ˚ ) |
|---|---|
| a = 57.12 | α = 90 |
| b = 82.96 | β = 90 |
| c = 113.66 | γ = 90 |
| Software Name | Purpose |
|---|---|
| MOSFLM | data reduction |
| SCALA | data scaling |
| AMoRE | phasing |
| CNS | refinement |
| CCP4 | data scaling |
RCSB PDB (citation) is hosted by
RCSB PDB is a member of the

